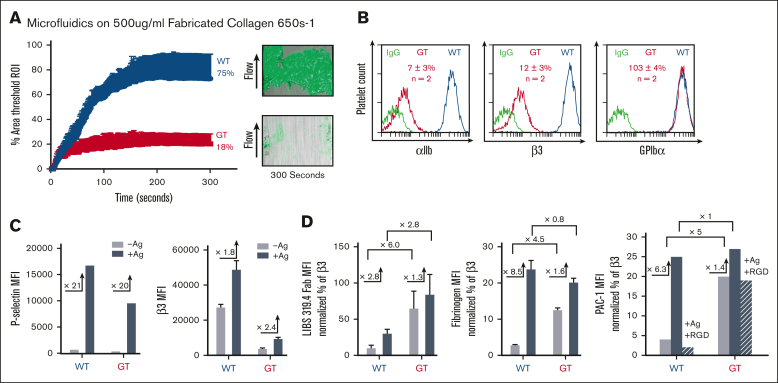
Figure 1.
Microfluidic and immunefluorescent cytometric analysis of patient platelets show reduced levels of a constitutively active integrin αIIbβ3 with some ability for platelet adhesion/aggregation consistent with a variant form of GT. (A) Microfluidic chamber analysis of whole blood adhesion/aggregation on collagen under physiological flow conditions. Anticoagulated whole blood from patient and control was 3,3′-dihexyloxacarbocyanine iodide labeled and perfused over fabricated type I collagen (350-500 μg/mL) coated microfluidic devices at 650 s−1 for 300 seconds. The percent surface area of platelets adhering and aggregating to the collagen matrix region of interest (ROI) was measured over time (seconds) and quantified at 17.8% ± 0.2% for GT vs 75.1% ± 1.3% for WT (n = 2 in triplicate ± standard error of the mean [SEM]) (left). Representative images taken from paired, representative flows demonstrate significant but visibly decreased surface area and aggregation of GT whole blood compared with WT control (n = 2 in triplicate ± SEM) (right). (B) Immunofluorescent analysis αIIbβ3 expressed on the platelet surface using mAbs specific for human αIIb (CD41, left) and β3 (CD61, middle) observed that platelets from patient with GT (red line) have significantly reduced MFI levels of integrin αIIb (7% ± 3%) and β3 (12% ± 3%) compared with that of WT (blue line), MFI arbitrarily set at 100% (n = 2 ± SEM). As a control for surface expression of a receptor not affected by GT, the MFI for GT GPIbα (103% ± 4%) was nearly equal to WT control with an Ab to human CD42b (n = 2 ± SEM) (right). A nonspecific mAb serves as an isotope negative immunoglobulin G (IgG) control (green line, all). (C) Immunofluorescent cytometric analysis for detection of P-selectin and αIIbβ3 receptor mean fluorescence intensity (MFI) levels on surface of platelets isolated from whole blood from WT control and patient with GT. Platelets were incubated in buffer (−Ag, light grey bar) or treated for 30 minutes with platelet activation agonists (+Ag, dark grey bar). Data are represented in each bar graph as MFI of measurements for the detection of mAbs recognizing increase in surface expression of P-selectin (CD62) as a positive control for platelet activation (n = 2) (left) and β3 (AP3) fold-increase in receptor expression (x) (n = 1 in triplicate + SEM) (right). Analysis with a nonspecific IgG mAb and a CD42 mAb served negative controls for Δ receptor level are not shown (n = 1 in triplicate + SEM). See Methods for further detail. (D) Immunofluorescent cytometric analysis demonstrating ability of WT and GT platelet surface expressed αIIbβ3 to bind “activation-sensitive” reagents listed under quiescent and activating conditions. The bar graph data sets are presented as MFI “activation-sensitive” reagent binding that is normalized to the percentage of β3 receptor density level detected by MFI of a “activation-nonsensitive” reagent AP3 measured on WT and GT platelets, respectively, in section C. Alexa Fluor 647–labeled Fab of mAb 319.4 (recognizing a LIBS exposed on β3) binding in absence of agonist (−Ag, light grey bar) or presence of platelet activation agonists (+Ag, dark grey bar) is shown (left). This is a representative graph using 1 (319.4) of 3 distinct LIBS Abs (n = 3 in triplicate + SEM). The binding of Alexa Flour 488–labeled human fibrinogen under quiescent (−Ag) or activating (+Ag) (n = 2 + SEM) is shown (middle). The binding of mAb fluorescein isothiocyanate–PAC-1 (fibrinogen mimetic Ab) under quiescent (−Ag) or activating (+Ag) (n = 2) is shown (right). Note, inhibition of PAC-1 binding with RGD peptide was measured in the presence of agonist (+Ag +RGD, striped bar, right) (n = 1). Alexa Fluor–labeled goat anti-mouse nonspecific IgG Abs served as negative controls (not shown) (n = 2). Please see Methods for further details.

