
Fig. 4. GSDMB3 and 4 mediate GzmA-triggered pyroptosis.
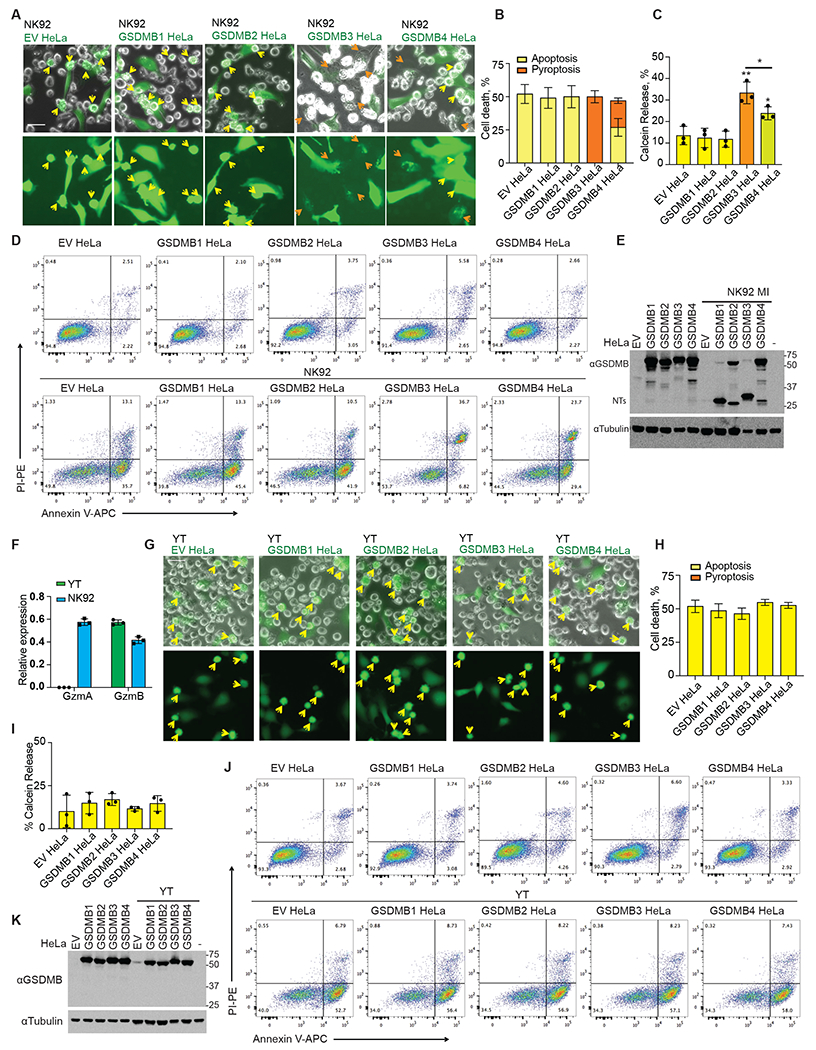
A and B, Representative fluorescent microscopy images of cocultures of NK-92 MI cells with calcein-labeled (green) empty vector and GSDMB-expressing HeLa cells (A). Yellow arrows indicate apoptotic cells and orange arrows indicate pyroptotic cells. The percentage of dead cells was counted and quantified using three images (B). C, Calcein release of empty vector and GSDMB-expressing HeLa cells induced by NK-92 MI cells (E/T ratio=3/1; 2h). D, GSDMB cleavage in GSDMB-expressing HeLa cells incubated with NK-92 MI cells at the E/T ratio of 3/1 for 2.5 h, assessed by immunoblotting. E, Indicated HeLa cells were co-incubated with NK-92 MI cells at the E/T ratio of 3/1 for 2.5 h. Cell death was assessed by Annexin V/ PI staining and flow cytometry. F, Expression of GzmA and GzmB in YT-INDY and NK-92 MI cells, assessed by qRT-PCR. G and H, Representative fluorescent microscopy images of cocultures of YT NK cells with calcein-labelled (green) empty vector and GSDMB-expressing HeLa cells (G). Yellow arrows indicate apoptotic cells. The percentage of dead cells was counted and quantified from three images (H). I, Calcein release of empty vector and GSDMB-expressing HeLa cells induced by YT cells (E/T ratio=3/1; 2h). J, GSDMB cleavage in GSDMB HeLa cells incubated with YT cells at the E/T ratios=3/1 for 2.5 h, assessed by immunoblotting. K, Indicated HeLa cells were co-incubated with YT cells at the E/T ratio of 3/1 for 2.5 h. Cell death was assessed by Annexin V/ PI staining and flow cytometry. Data in bar graphs are mean ± s.d. of biological triplicates and are representative of three independent experiments. Comparisons were calculated by two-tailed Student’s t-test. **P < 0.01. *P < 0.05 Scale bar, 20 μm.