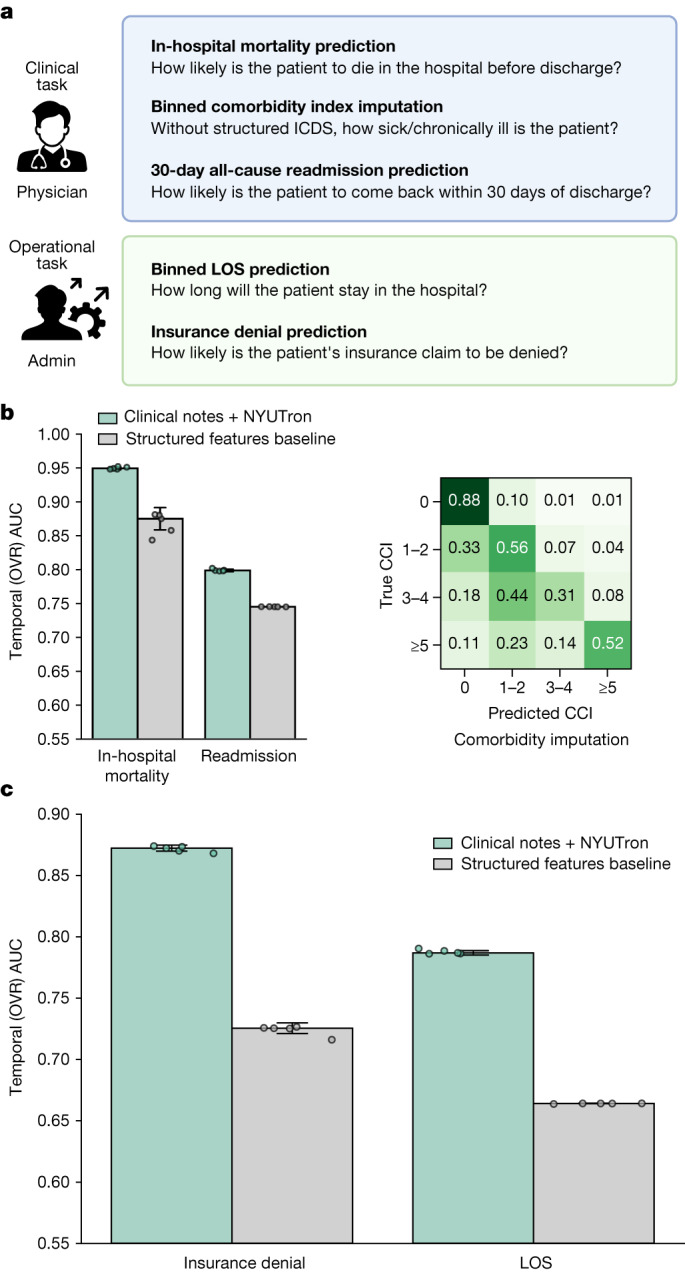
Fig. 2. Overall temporal test performance across five tasks.

a, The five tasks include three clinical tasks and two operational tasks. b, On readmission prediction, NYUTron had a median AUC of 79.9% ± 0.168% with a 5.36% improvement. On in-hospital mortality prediction, NYUTron had a median AUC of 94.9% ± 0.168% with a 7.43% improvement. On comorbidity index imputation, NYUTron had an OVR median AUC of 89.4% ± 0.275%. A confusion matrix is shown on the right. c, On binned LOS prediction, NYUTron had a median AUC of 78.7% ± 0.179% with a 12.3% improvement from the structured baseline. On insurance denial prediction, NYUTron had a median AUC of 87.2% ± 0.246% with a 14.7% improvement. For b,c, the height of the error bar is the median AUC and the half-width of the error bar is 1 s.d. The grey points are individual data points from n = 5 experiments using distinct random seeds.
