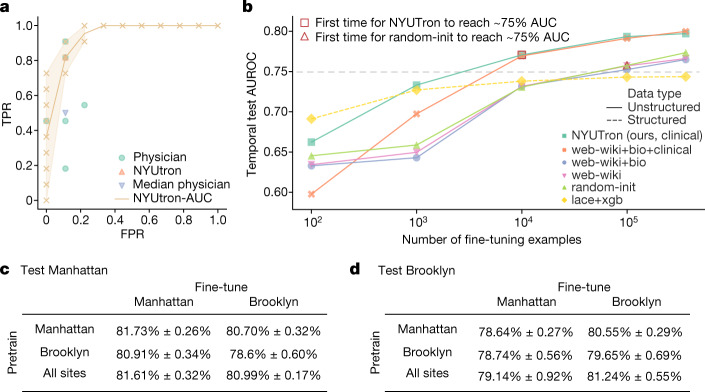
Fig. 3. Retrospective study of NYUTron’s readmission prediction.
a, On 20 cases sampled from a random split, we compared NYUTron’s TPR and FPR with those for six physicians. NYUTron (orange triangles) had a higher TPR and the same FPR when compared with the median physician performance (green circles). The error band for AUC ranges from the minimum to maximum, and the orange crosses indicate TPR and FPR using all possible thresholds. We chose NYUTron’s threshold on the basis of validation data. b, Comparison of the temporal test AUCs of different pretrained LLMs with an increasing number of fine-tuning examples. For simplicity, we omit the variance and only plot the median performance of five trials. Differences in median performance with 100 and 1,000 examples are less notable because AUCs with sparse fine-tuning examples have high variance (at 100 examples, we had 4.26% to 9.56% variance; at 1,000 examples, we had 0.44% to 9.46% variance). AUC variance decreases with more fine-tuning examples. The horizontal dashed line at 0.75 corresponds to the threshold for performance. See alternative presentations in Extended Data Fig. 7. c,d, Temporal test performance of NYUTron using pretraining, fine-tuning and test data from different sites. For both the Manhattan and Brooklyn tests, the column corresponding to local fine-tuning shows better performance than that with external fine-tuning. Each entry in c,d is presented as the mean ± 1 s.d. for n = 5 experiments using distinct random seeds.

