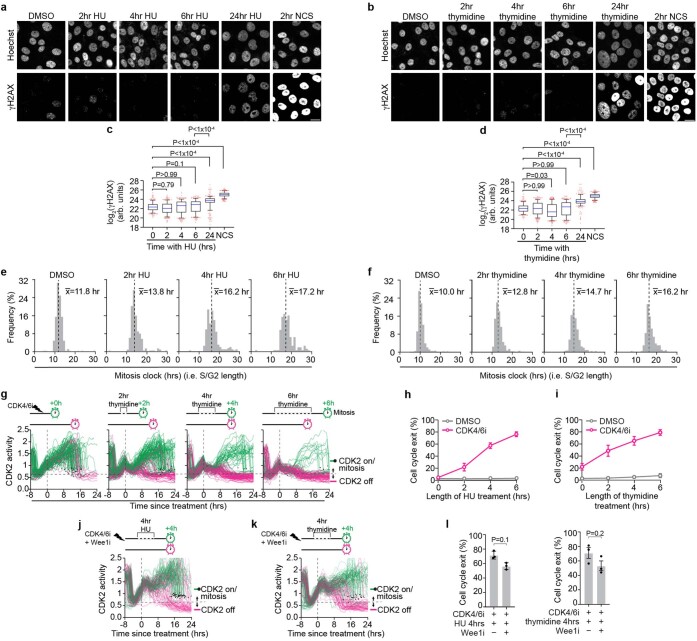
Extended Data Fig. 6. CDK4/6 inhibition induces exit when S/G2 is stretched.
a,b, γH2AX staining in MCF-10A p21−/− cells treated with either DMSO, hydroxyurea (HU), thymidine, or neocarzinostatin (NCS) for the indicated time. NCS treatment was used as a positive control. 20 μm scale bar. c,d, Box and whisker plot showing quantification of γH2AX nuclear intensity from (a,b). Blue line represents population mean. Whiskers represent 5–95th percentiles. Red dots indicate cells outside the 5–95th percentiles. One-way ANOVA and Kruskal-Wallace was used to test for statistical significance. P-values from top to bottom for c: <1 × 10⁻⁴, <1 × 10⁻⁴, <1 × 10⁻⁴, 0.1, >0.99, 0.79. P-values from top to bottom for d: <1 × 10⁻⁴, <1 × 10⁻⁴, <1 × 10⁻⁴, >0.99, 0.03, >0.99. N = 500 cells Per condition. e,f, Histograms showing S/G2 length of MCF-10A p21−/− cells after transient hydroxyurea (HU) or thymidine treatment. g, CDK2 activity traces from MCF-10A p21−/− cells aligned to time of treatment with thymidine and CDK4/6i. The length of increase in the mitosis clock is indicated above each plot. Green traces indicate cells which entered mitosis (black dots) and pink traces indicate cells which exited the cell cycle (CDK2 < 0.6). N = 129, 200, 157, or 119 cells in each condition. N = 130, 200, 158, and 120 cells respectively. h, Quantification of the percent of cells exiting the cell cycle after HU treatment from traces in Fig. 2j. Error bars represent SEM from n = 3 independent experiments. i, The percentage of MCF-10A p21−/− cells that exit the cell cycle after treatment with thymidine for various durations as a function of the increase in S/G2 length. Quantification from traces in (g). Error bars represent SEM from n = 3 independent experiments. j,k, CDK2 activity traces aligned to time of treatment with CDK4/6i and Wee1i plus a 4 h pulse of hydroxyurea (HU) or thymidine in MCF-10A p21−/− cells. Green traces indicate cells which entered mitosis (black dots) and pink traces indicate cells which exited the cell cycle (CDK2 < 0.6). Note that the Wee1i rescues the drop in CDK2 activity for both treatments (see Fig. 2j) but does not interfere with the ability of cells to exit the cell cycle. N = 200 cells. l, Quantification of the percent of cells that exited to the G0-like state after the indicated treatment. A two-tailed Mann-Whitney U test from n = 3 independent experiments shows no significant effect of Wee1 inhibitor on the ability of cells to exit to the G0-like state in response to a four hour pulse of either HU (left) or thymidine (right). P-values from left to right: 0.1, 0.2. Error bars represent SEM.

