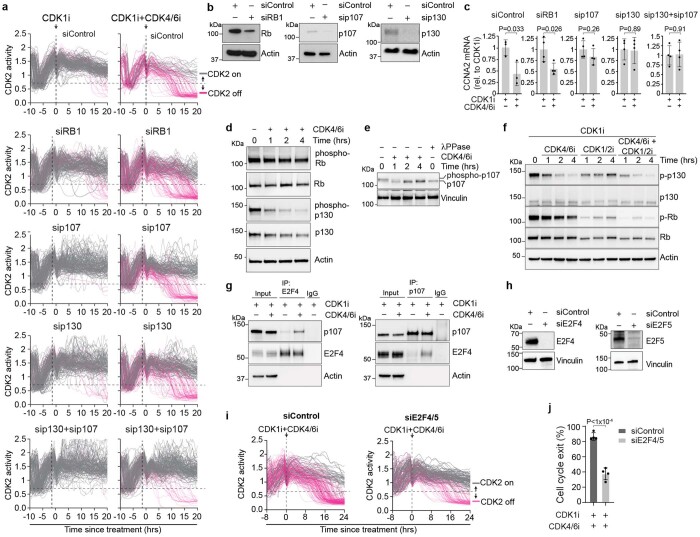
Extended Data Fig. 8. p107/p130 inhibit CDK2 activity after mitogen loss.
a, Single-cell traces of CDK2 activity aligned to time of treatment for the indicated conditions. Grey and pink traces represent cells with CDK2 > 0.6 and CDK2 < 0.6 at the end of the observation period, respectively. N > 117 Cells per plot. b, Western blot validation of Rb, p107, and p130 knockdown using siRNA. Representative image of n = 2 experiments. c, qRT-PCR data showing mRNA levels normalized to CDK1i treatment alone for cells treated with a CDK4/6i for 2 hrs. Error bars represent SD from N = 4 replicates (N = 3 for siControl). Representative of n = 3 experiments. P-values were calculated using a one-way ANOVA. P-values from left to right: 0.033, 0.026, 0.26, 0.89, 0.91. d, Western blot time-course of phospho-p130 (S672) and phospho-Rb (S807/811) after CDK4/6i treatment. Cells were pre-treated with a CDK1i for 24 hrs to arrest cells in a post-R state and then treated with either DMSO or a CDK4/6i for the indicated times. Representative image of n = 5 experiments. e, Western blot time-course showing a loss of p107 phosphorylation after CDK4/6i treatment. Arrows indicate the phosphorylated and unphosphorylated forms of p107. Representative image of n = 2 experiments. f, Western blot time-course in cells treated with a CDK1i and then either CDK4/6i alone, CDK1/2i Alone, or both. g, Coimmunoprecipitation of p107 and E2F4 in cells treated with a CDK1i overnight and then treated with and without a CDK4/6i for 4 hrs. Top: IP with E2F4 antibody. Bottom: IP with p107 antibody. Representative image of n = 2 experiments. h, Western blot validation of E2F4 and E2F5 knockdown using siRNA. Representative of n = 2 experiments. i, Single cell traces of CDK2 activity aligned to time of treatment for cells treated as indicated. Grey and pink traces represent cells with CDK2 > 0.6 and CDK2 < 0.6 at the end of the observation period, respectively. N = 197 and 167 cells respectively. j, Quantification of the percent of cells that exit the cell cycle as in (h). Error bars represent SEM from n = 4 experiments. P-values were calculated using a two-tailed Students T-test. P < 1 × 10⁻⁴.

