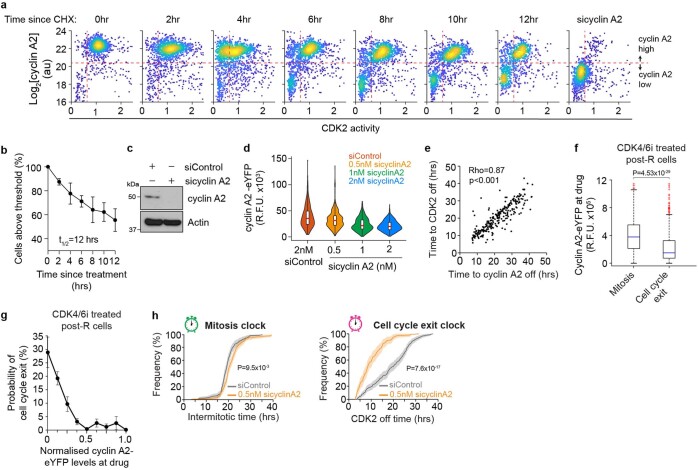
Extended Data Fig. 9. Cyclin A2 stability determines the cell cycle exit clock.
a, Density scatter plots of cyclin A2 levels against CDK2 activity after treatment with cycloheximide at indicated timepoints. The vertical dashed red line indicates the threshold of CDK2 activity that is required to maintain Rb phosphorylation (CDK2 = 0.6). The horizontal dashed red lines separate cells with high vs low cyclin A2 protein levels (top row). The last panel shows cyclin A2 levels for cells treated with cyclin A2 siRNA to establish the threshold for high vs low cyclin A2 levels. N > 1,300 Cells per plot. b, Plot of percent of cyclin A2 low cells over time after treatment with cycloheximide. Error bars represent SEM from n = 3 experiments. t1/2 indicates the measured half-life. c, Western blot validation of cyclin A2 knockdown using siRNA. d, Violin and box plots showing single-cell cyclin A2-eYFP levels after treatment with various concentrations of siRNA targeting cyclin A2. Red line represents population mean. From left to right, N = 566, 479, 487, and 394 cells. The box plots show the median (centre line), interquartile range (box limits), and minimum and maximum values (whiskers). e, Scatter plot showing the correlation between the time to lose CDK2 activity (CDK2 < = 0.6) and cyclin A2 levels (cyclin A2 < = G1 levels of cyclin A2). Rho, pearson’s correlation coefficient. N > 396 cells per condition. f, Data are a box and whisker plot of the cyclin A2-eYFP levels at the time post-R U2OS cells were treated with CDK4/6i in cells that either reached mitosis or exited the cell cycle. Blue line represents the population mean. Whiskers represent 5–95th percentiles. Red dots indicate single-cell outliers beyond the 5–95th percentiles. A Mann Whitney U test was used to test for statistical significance. P = 4.53 × 10⁻²⁹. N = 915 (mitosis) and 333 (cell cycle exit) cells. g, Probability of cell cycle exit as a function of the cyclin A2-eYFP levels at the time the CDK4/6i was added. Error bars represent SEM from n = 4 experiments. h, Empirical cumulative distribution of intermitotic times (left panel) and cell cycle exit times (right panel) for cells treated with control siRNA and 0.5 nM cyclinA2 siRNA. P-values were calculated using a two-tailed Kolmogorov Smirnov test. Mitosis clock (P = 9.5 × 10⁻³) and cell cycle exit (P = 7.6 × 10⁻¹⁷).

