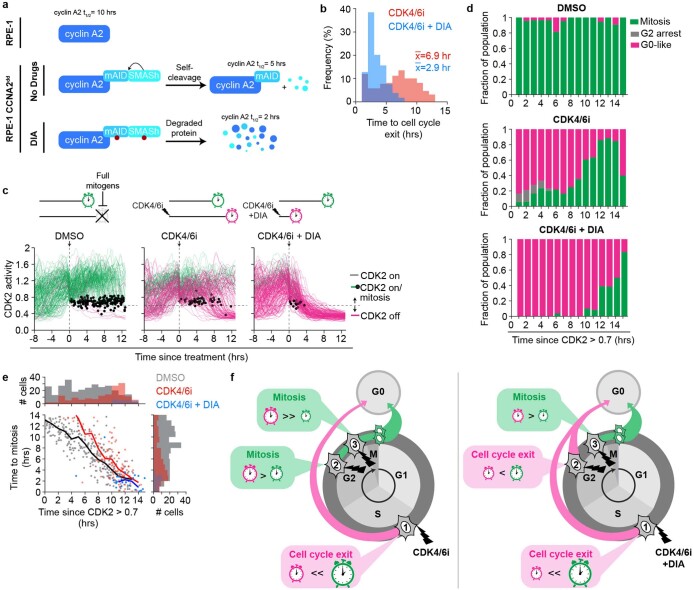
Extended Data Fig. 10. Destabilizing cyclin A2 shortens the cell cycle exit clock.
a, Schematic of the inducible degron system used to de-stabilize cyclin A2. For details about the inducible-degron system, see Methods section. b, Histogram of the cell cycle exit times for RPE-1 CCNA2dd cells treated with a CDK4/6i or CDK4/6i plus DIA. c, Single cell traces of CDK2 activity aligned with respect to time of treatment for cells treated as indicated in RPE-1 CCNA2dd cells. Green traces depict cells that remained committed to the cell cycle and entered mitosis (indicated by black dot). Grey and pink traces represent cells with CDK2 > 0.6 and CDK2 < 0.6 at the end of the observation period, respectively. For each condition, N = 200 cells are shown. d, Cell fate of RPE-1 CCNA2dd cells from (c) binned by the time since CDK2 activity rose above 0.7 when the drug was added. Representative data from n = 2 independent experiments. e, Scatter plot of single cells comparing the time since CDK2 activity rose above 0.7 when the drug was added versus the time after treatment when cells reached mitosis. Single-component histograms shown above and to the right. Solid lines represent the average for each condition as indicated. DMSO, N = 280; CDK4/6i, N = 126; CDK4/6i + DIA, N = 26 cells. f, Left: Upon CDK4/6 inhibitor treatment, cells closer to the start of S phase, and therefore far away from mitosis (Cell 1), are more likely to exit the cell cycle, whereas cells close to mitosis (Cell 2 and 3) are more likely to reach mitosis. Right: Destabilizing cyclin A2 by treating cells with DIA shortens the cell cycle exit clock, which means that, relative to cells without DIA, cells closer to mitosis (Cell 2) when the CDK4/6 inhibitor is added are more likely to exit the cell cycle.

