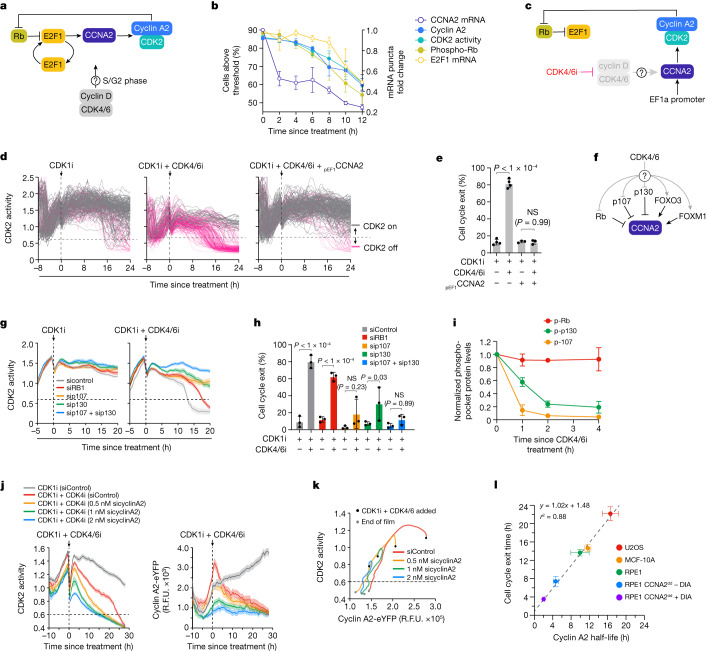
Fig. 3. CDK4/6 promotes cyclin A2 synthesis in S/G2.
a, Proposed CDK2–Rb feedback loop model. b, Measurements of each component in a taken after treatment with CDK1i + CDK4/6i. n = 2 for CCNA2 mRNA and E2F1 mRNA, n = 3 for cyclin A2 protein and CDK2 activity and n = 4 for phospho-Rb levels. Error bars represent s.e.m. c, Experimental design to test if cyclin A2 expression from an unregulated promoter can rescue loss of CDK2 activity after CDK4/6i treatment. d, CDK2 activity traces for cells treated as indicated. Grey and pink traces represent cells with CDK2 greater than 0.6 and CDK less than 0.6 activity at 24 h, respectively. N = 200, 209 and 200 cells, respectively. e, Percentages of cells that exited the cell cycle from d. Error bars represent s.e.m. from n = 4 independent experiments. P values were calculated using a one-way analysis of variance. P values from top to bottom are less than 1 × 10⁻⁴ and 0.99. f, CDK4/6 substrates that are proposed regulators of CCNA2 transcription. g, Median CDK2 activity traces for cells aligned to time since treatment for the indicated conditions. Shaded regions represent 95% confidence intervals. N > 1,000 cells per condition. Dotted horizontal lines represent CDK2 activity below the threshold required for Rb phosphorylation (CDK2 less than 0.6). h, Percentages of cells that exited the cell cycle from g. Error bars represent s.e.m. from n = 3 independent experiments. P values were calculated using a one-way analysis of variance. P values from left to right are less than 1 × 10⁻⁴, less than 1 × 10⁻⁴, 0.23, 0.03 and 0.89. i, Quantification of phosphorylated pocket proteins after CDK4/6i treatment. Levels of each phosphoprotein were normalized to the total levels of the respective protein. Error bars represent s.e.m. (Rb, n = 5; p107, n = 2; p130, n = 3 independent experiments). j, Median CDK2 activity traces (left panel) and endogenous cyclin A2 levels (right panel) aligned to time since treatment for U2OS-eYFP cells. Shaded regions indicate 95% confidence intervals. k, Phase plot of median CDK2 activity and median endogenous cyclin A2 levels. l, Cell cycle exit times as a function of cyclin A2 half-life for indicated cell lines. Equations for the best-fit line and r2 value are shown. Error bars represent s.e.m. (U2OS, n = 5; MCF-10A, n = 6; RPE-1, n = 4; RPE-1 CCNA2dd-DIA, n = 2; RPE CCNA2dd + DIA, n = 2 independent experiments). R.F.U., relative fluorescence units.

