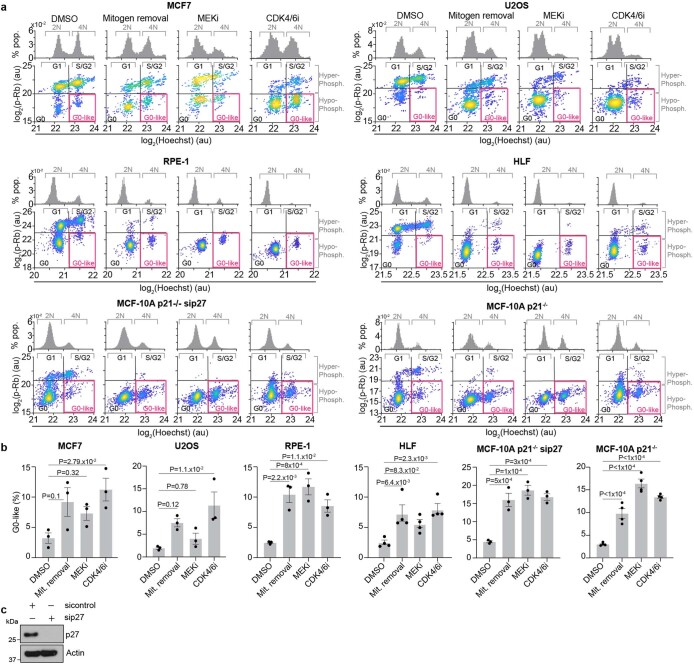
Extended Data Fig. 1. Diverse cell types rely on mitogens in S/G2.
a, Effect of loss of mitogen signalling on Rb phosphorylation and DNA content in diverse cell types: MCF7, transformed breast epithelial cells; U2OS, transformed osteosarcoma cells; RPE-1, non-transformed hTERT-immortalized retina pigmented epithelial cells; HLF, primary human lung fibroblasts; MCF-10A, non-transformed breast epithelial cells. Histograms show DNA content for each treatment (top). Scatter plots of Rb phosphorylation vs DNA content for each treatment (bottom). Pink boxes mark the G0-like state (hypo-phosphorylated Rb and 4N DNA content). All treatments were for 48 hrs. N = 2,000 cells are plotted per condition. b, The percentage of G0-like cells for each condition from (a) is indicated. Error bars are SEM from at least n = 3 biological replicates. P-values were calculated using a one-way ANOVA. P-values from top to bottom; MCF7: 2.79 × 10⁻², 0.32, 0.1, U2OS: 1.1 × 10⁻², 0.78, 0.12, RPE-1: 1.1 × 10⁻², 8 × 10⁻⁴, 2.2 × 10⁻³, HLF: 2.3 × 10⁻³, 8.3 × 10⁻², 6.4 × 10⁻³, MCF-10A p21−/− sip27: 3 × 10⁻⁴, 1 × 10⁻⁴, 5 × 10⁻⁴, MCF-10A p21−/−: <1 × 10⁻⁴, <1 × 10⁻⁴, <1 × 10⁻⁴. c, Western blot validation of p27 knockdown using siRNA. Representative image of n = 2 independent experiments.

