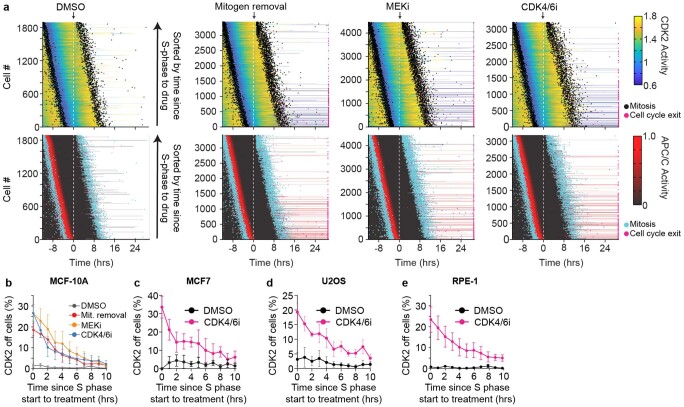
Extended Data Fig. 3. Proximity to S-phase start determines cell fate.
a, Heatmaps of CDK2 activity (top) and APC/C activity (bottom) for post-R cells sorted by time since S-phase entry at treatment. When treated with DMSO all post-R cells divide within 24 hrs indicated by black/cyan dots. Upon mitogen removal or MEKi treatment some cells divide (black/cyan dots) and others lose CDK2 activity and exit the cell cycle (pink dots). b, Probability of cell cycle exit as a function of the time since the start of S phase at treatment for each treatment as indicated. Error bars represent SEM from n = 3 experiments. c–e, Probability of cell cycle exit as a function of the time since the start of S phase at treatment as indicated in MCF7 cells (c), U2OS cells (d), or RPE-1 cells (e). Error bars represent SEM from n = 3 experiments (c,d) or n = 5 experiments (e).

