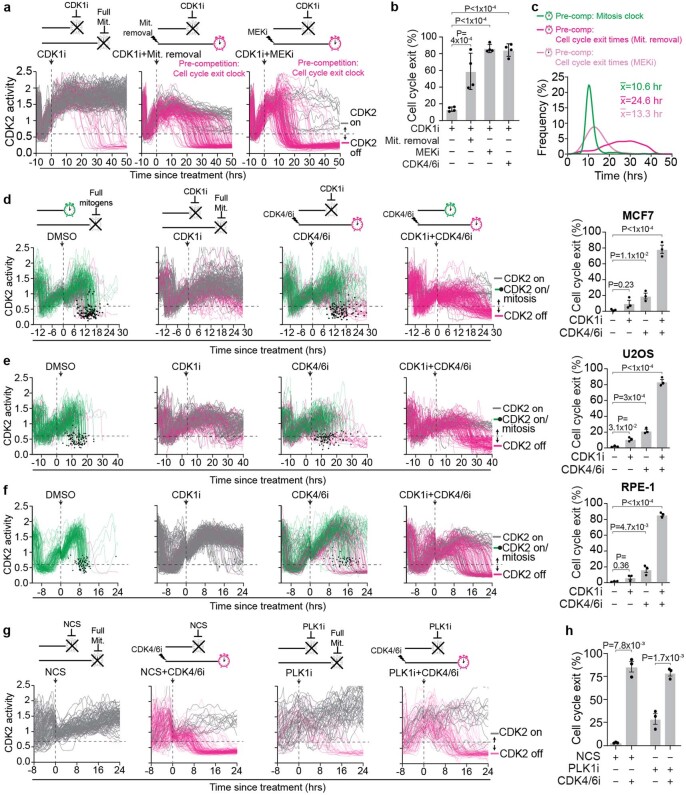
Extended Data Fig. 4. Cells require mitogen signalling if mitosis is blocked.
a, Single cell traces of CDK2 activity aligned with respect to time of treatment for cells treated as indicated. Grey and pink traces represent cells with CDK2 > 0.6 and CDK2 < 0.6 at the end of the observation period, respectively. N = 200 cells per condition. b, Percentage of cells that exit the cell cycle after blocking the mitosis clock with a CDK1i and combining that with mitogen removal, MEKi, or CDK4/6i treatment. Error bars represent SEM n = 4 experiments. P-values were calculated using a one-way ANOVA. P-values from top to bottom: <1 × 10⁻⁴, <1 × 10⁻⁴, 4 × 10⁻⁴. c, Histograms showing the pre-competition distribution of cell cycle exit times, measured from (a) and the pre-competition distribution of mitosis times, measured from Fig. 2e. d–f, Right, single cell traces of CDK2 activity aligned with respect to time of treatment for cells treated as indicated in MCF7 cells (d), U2OS cells (e), or RPE-1 cells (f). Green traces depict cells that remained committed to the cell cycle and entered mitosis (indicated by black dot). Grey and pink traces represent cells with CDK2 > 0.6 and CDK2 < 0.6 at the end of the observation period, respectively. N = 200 cells per plot, with the exception of the DMSO condition in (f), which contains N = 117 cells. Left, quantification of the percent of cells exiting the cell cycle. Error bars represent SEM from n = 3 experiments. P-values were calculated using a one-way ANOVA. P-values from top to bottom; MCF7: <1 × 10⁻⁴, 1.1 × 10⁻², 0.23, U2OS: <1 × 10⁻⁴, 3 × 10⁻⁴, 3.1 × 10⁻², RPE-1: <1 × 10⁻⁴, 4.7 × 10⁻³, 0.36. g, CDK2 activity traces aligned to time of treatment for the indicated conditions in MCF-10A p21−/− cells. N = 99, 148, 67, and 85 cells respectively. h, Quantification of percent of cells that exit from (g). Error bars represent SEM from n = 3 experiments. P-values were calculated using a one-way ANOVA. P-values from top to bottom: 7.8 × 10⁻³, 1.7 × 10⁻³.

