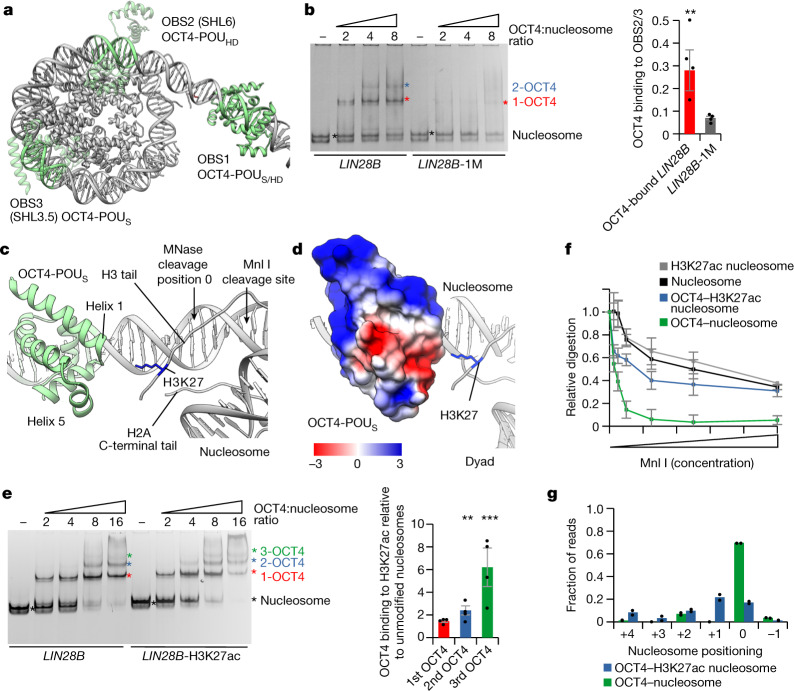
Fig. 3. Histone modifications modulate OCT4 cooperativity.
a, Model of OCT4 bound to the LIN28B nucleosome. OCT4-binding sites are in green, OCT4 bound to OBS1 is in solid green, and the OCT4 structure superimposed on OBS2 and OBS3 is in transparent green. b, Representative native gel electrophoresis showing OCT4 binding to LIN28B or LIN28B-1M nucleosomes (left). The asterisks mark the number of OCT4 bound: the nucleosome is in black, 1-OCT4 (one OCT4 molecule bound) is in red, and 2-OCT4 (two OCT4 molecules bound) is in blue. Band composition was validated by immunoblotting (Extended Data Fig. 5g). Quantification of binding of OCT4 to OBS2 and OBS3 is also shown (right). Data shown are mean ± s.e.m., n = 4 independent experiments; **P = 0.008, one-sided Student’s t-test. For quantification, we used 2-OCT4 and 1-OCT4 bands for the LIN28B nucleosome, or 1-OCT4 and input nucleosome bands for the LIN28B-1M nucleosome (see Methods and Supplementary Table 3). c, View of the nucleosome entry–exit site showing the interaction of OCT4-POUS with the histone H3 N-terminal and the histone H2A C-terminal tails. d, Electrostatic potential surface map of OCT4-POUS interacting with the positively charged histone H3 tail. e, Representative native gel electrophoresis showing OCT4 binding to the LIN28B or LIN28B-H3K27ac nucleosomes (left). The asterisks are as in panel b, with the green asterisk marking 3-OCT4 (three OCT4 molecules bound). Quantification of OCT4 binding to H3K27ac relative to unmodified nucleosomes is also shown (right); 1st, 2nd or 3rd OCT4 (horizontal axis) indicates binding of the 1st, 2nd or 3rd molecule of OCT4, respectively. Data shown are mean ± s.e.m., n = 4 independent experiments; **P = 0.008 and ***P = 0.004, one-sided Student’s t-test. f, Quantification of Mnl I digestion of free or OCT4-bound nucleosomes, unmodified or with H3K27ac. The y axis shows the intensity of nucleosome bands after digestion, normalized to input. Data shown are mean ± s.e.m., n = 4 independent experiments. Representative gels are shown in Extended Data Fig. 6d. g, Quantification of sequencing of MNase I-digested OCT4-bound nucleosomes, unmodified or with H3K27ac. The x axis shows the position of the first base pair relative to the most abundant position (0 as observed in the structure). Data are mean and spread of two independent experiments. A more detailed representation is shown in Extended Data Fig. 6f.

