
Fig. 4.
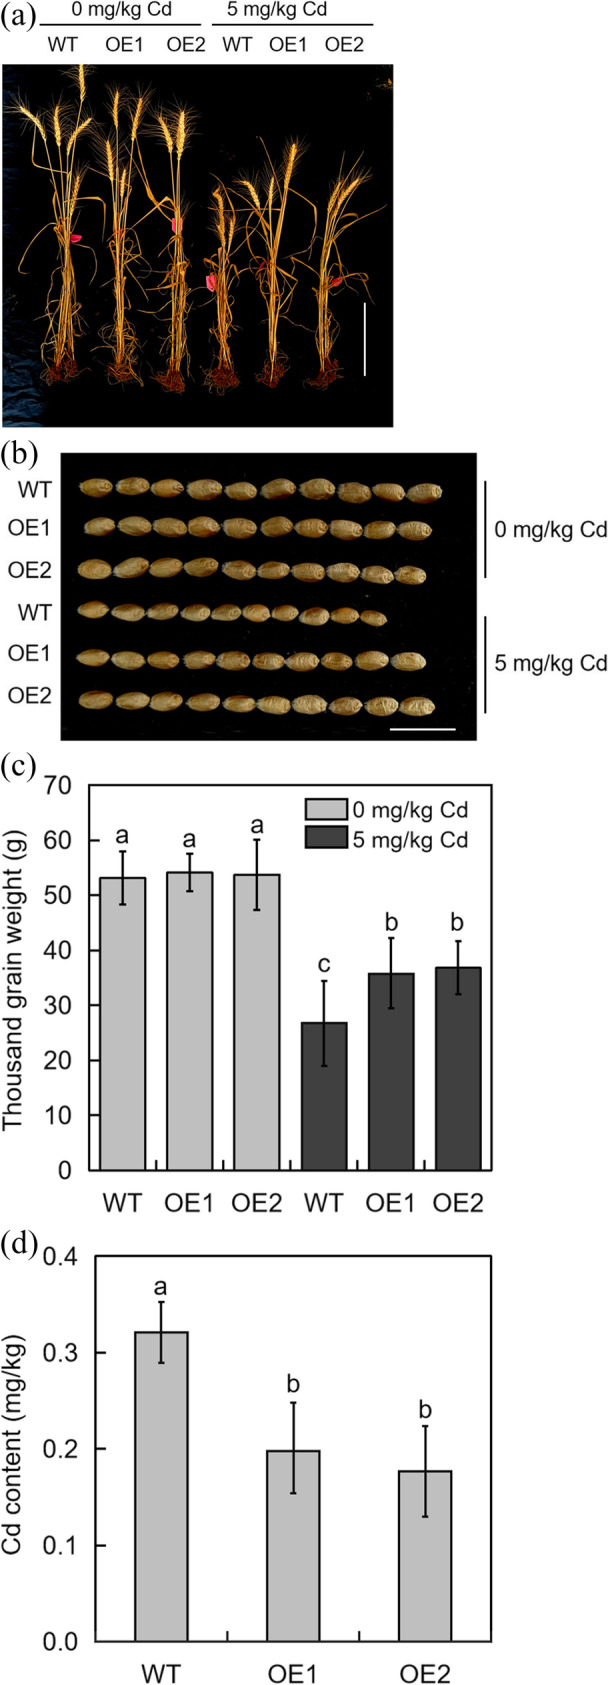
a Plant phenotypes of WT and TabHLH094 overexpression lines were observed with or without Cd. Scale = 30 cm. b Grain phenotypes of WT and TabHLH094 overexpression lines were observed with or without Cd. Scale = 2 cm. c Thousand-grain weight of WT and TabHLH094 overexpression lines under control and Cd stress conditions. Each value is the mean ± SE (n = 3). Different lowercase letters signify significant (P < 0.05) differences. d Cd content in the grains of WT and TabHLH094 overexpression lines under 5 mg/kg Cd conditions. Each value is the mean ± SE (n = 3). Different lowercase letters signify significant (P < 0.05) differences