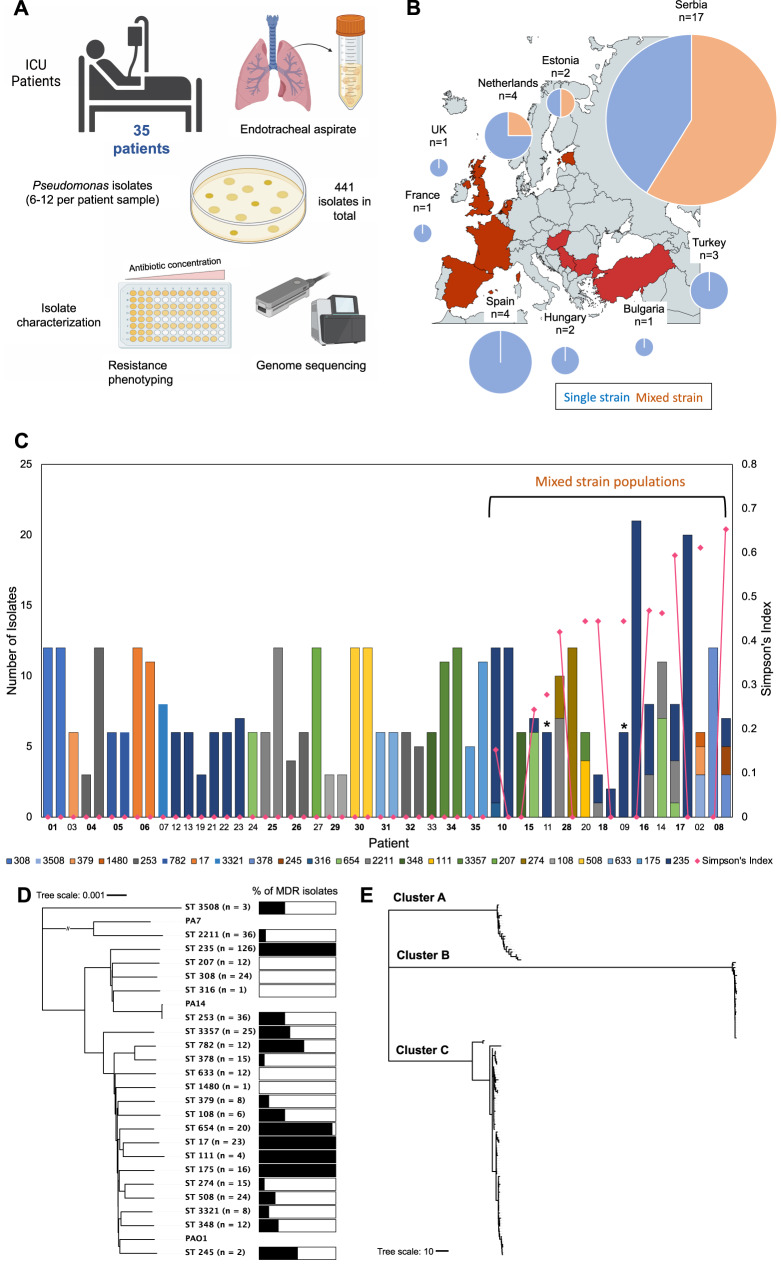
Fig. 1. Overview of patient cohort, methodology, and isolate dataset.
A Overview of sample collection. Endotracheal aspirate was collected from 35 patients with up to 12 Pseudomonas isolates per patient sample. A total of 441 isolates were collected and characterized via resistance phenotyping and genome sequencing. B Map showing distribution of patient samples. Pie charts show total mixed strain (orange) and single strain (blue) patients per country. Pie chart size is adjusted by patient number, patient number is shown by ‘n=’ above the corresponding chart. Figure was created using mapchart.net. C Within-host diversity of P. aeruginosa. Bar height indicates the number of isolates and bar colour indicates the Sequence Type(s) (ST) of P. aeruginosa collected from each patient in the study cohort. Mixed strain populations were identified in 12/35 patients. Patient numbers in bold indicate longitudinally sampled patients, and the isolates from each sample are shown sequentially. * indicates patients with a mixed strain population consisting of isolates from multiple distinct ST235 sub-lineages. Plotted points show the diversity of clones within patients, as measured by Simpson’s Index, and the lines show how Simpson’s Index changes in between samples in patients with two samples. D Neighbour joining phylogeny based on core genes of all STs found in this study and the respective proportion of MDR isolates in each ST82. nucleotide substitutions per site. E Neighbour joining phylogeny based on core genes of ST235 isolates showing the three distinct ST235 sub-lineages (cluster A, B and C)82. Scale = nucleotide substitutions. The raw data is presented in the source data file.

