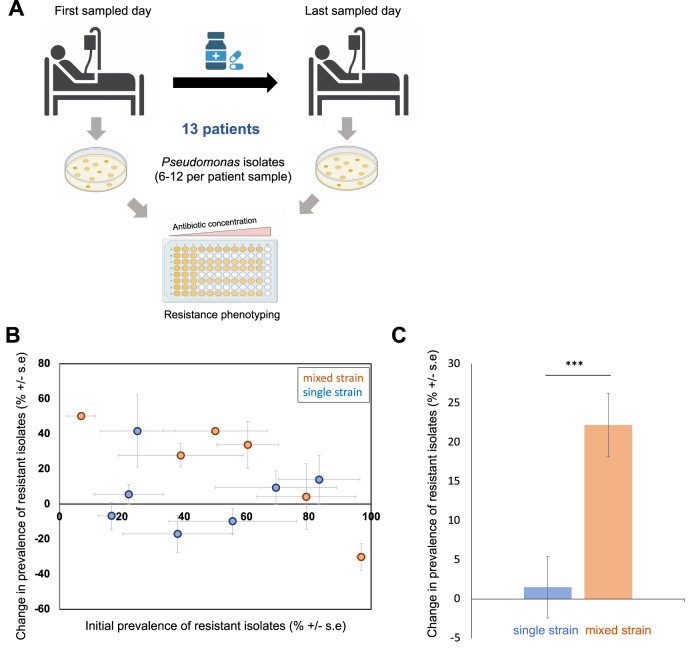
Fig. 2. Mixed strain populations accelerate the emergence of resistance.
A Resistance phenotyping of isolates from the subset of 13 longitudinally sampled patients that were treated with antibiotics that are active against Pseudomonas. B Change in the prevalence of antibiotic-resistant isolates in patients with single strain (blue) and mixed strain (orange) populations. Resistance to six antibiotics was measured and the proportion of isolates that were resistant to each antibiotic at each time point was calculated. Data are presented as mean values for the proportion of isolates that were resistant to each antibiotic for the first sampling point (initial prevalence) and the difference between sampling points (change in prevalence), from a minimum of n = 5 isolates per patient (source data file). Error bars show the standard error of initial resistance (x-axis; n = 6 antibiotics) and the change in resistance (y-axis; n = 6 antibiotics) across antibiotics. C Bars show the mean (+/−s.e.) change in the prevalence of resistant isolates in single strain (n = 7 patients; blue) and mixed strain (n = 6 patients; orange) populations after correcting for the effect of initial resistance. Mixed strain populations were associated with larger increases in resistance in response to antibiotic treatment (main effect diversity, F1,52 = 15.03, P = 0.0003). The statistical model used to analyse this data is described in the methods and the model output is given in Supplementary Table 3. The raw data is presented in the source data file.

