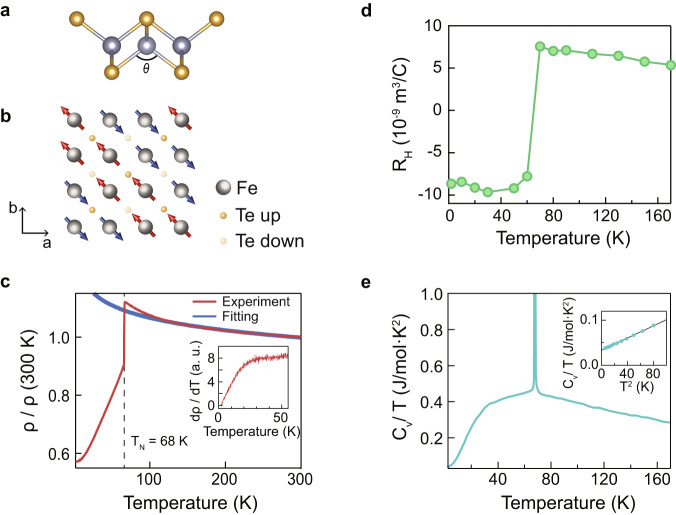
Fig. 1. Crystal structure and transport results of FeTe.
a Crystal structure of FeTe. b Spin configuration of bicollinear antiferromagnetic (BAFM) state in FeTe. c Temperature-dependent resistivity. The red curve is the experimental data, while the blue curve is the fitting result of the logarithmic function () of the data between 120 and 300 K. Inset shows the temperature-derivative of the resistivity. d Temperature-dependent Hall coefficient. e Temperature-dependent Cv/T. Inset shows Cv/T vs T2 plot in the low-temperature region. The black solid line in the inset is the fit result of Cv/T = γ + βT2. Source data are provided as a Source Data file.

