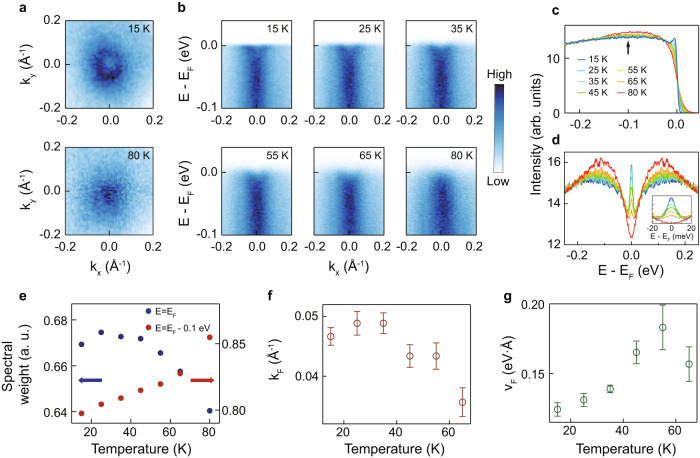
Fig. 2. Electronic structure of FeTe.
a Fermi surface (FS) maps from high-resolution laser ARPES measurements, obtained at 15 and 80 K. b Temperature-dependent high symmetry cuts along the Γ’-X’ direction. ARPES data were taken with 11 eV photons. c Energy distribution curves (EDCs) integrated within a certain momentum range (kx2 + ky2 < (0.15 Å−1)2). The EDCs are normalized with the integrated intensity from an energy window of −0.25 eV <E—EF < −0.2 eV. d Symmetrized EDCs of (c). Inset: enlarged view of EDCs near the Fermi level. e Temperature-dependent spectral weight at E = EF and E = EF – 0.1 eV. f, g Temperature-dependent Fermi momentum (kF) and Fermi velocity (vF), respectively, obtained from momentum distribution curve (MDC) analysis. Errors bars in (f, g) represent the fitting errors of Fermi momentum and Fermi velocity, respectively. Source data are provided as a Source Data file.

