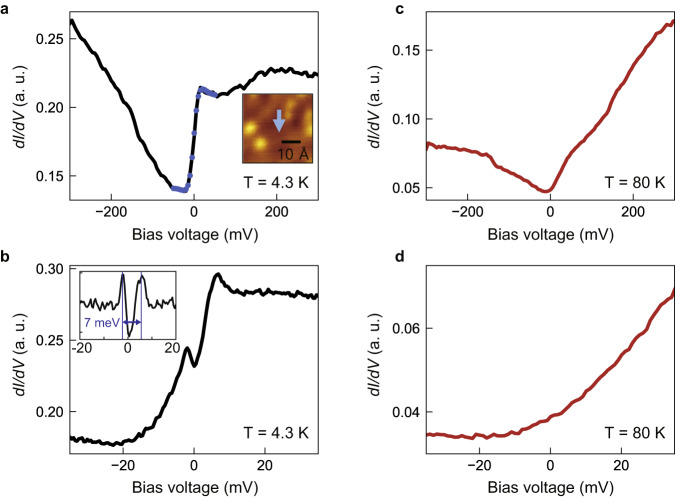
Fig. 4. STS results on FeTe.
a Differential conductance (dI/dV) spectrum measured on FeTe surface at 4.3 K. The blue circles represent the Fano fitting of the Kondo resonance (see Supplementary Note 4 for the fitting parameters). The inset shows the position where the spectrum is taken. Vbias = −300 mV, I = 100 pA, and lock-in modulation Vmod = 5 mVpp. b dI/dV spectrum enlarged around the Fermi energy. The inset is the spectrum after subtracting the smoothly varying background. Vbias = −40 mV, I = 100 pA and Vmod = 500 μVpp. c dI/dV spectra measured at 80 K. Vbias = −300 mV, I = 50 pA and Vmod = 5 mVpp. d Zoomed-in dI/dV spectrum. Vbias = −40 mV, I = 50 pA and Vmod = 500 μVpp. Source data are provided as a Source Data file.

