Figure 3.
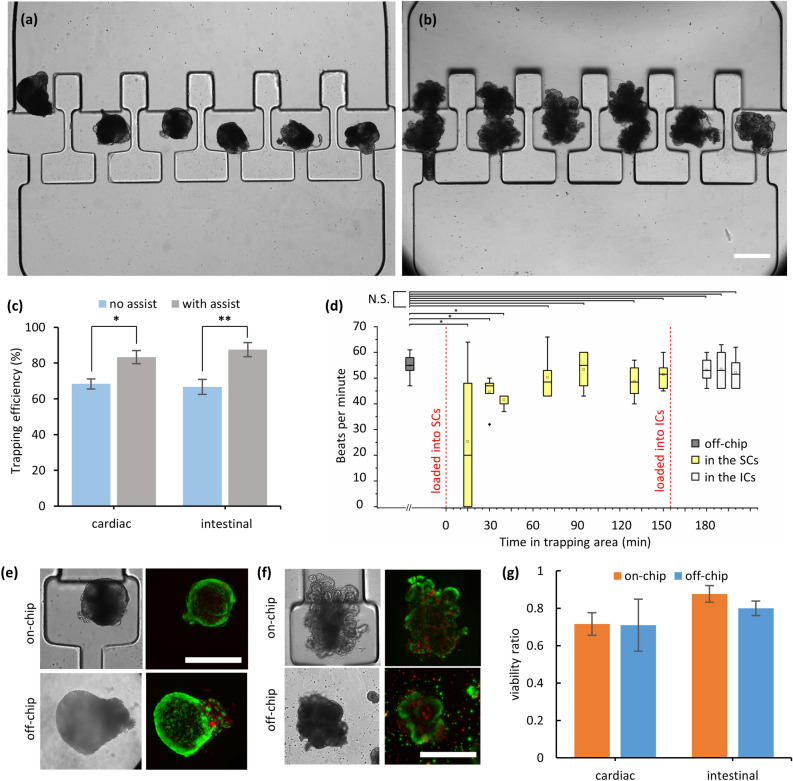
OrganoidChip performance characterization. (a, b) Representative images showing cardiac (a) and intestinal (b) organoids that were uniformly distributed between the TAs of the chip. (c) The trapping efficiency is reported as the number of filled TAs to the total number of TAs (i.e., 6). We performed 11 different sets of chip experiments for cardiac and 8 for intestinal organoids. Trapping efficiencies significantly increased when assisted loading procedures of flow reversal and chip titling were used (n = 6 TAs per chip). (d) Beating rate of the cardiac organoids as a function of time upon loading into the chip. The data shows no significant changes of the beating rates after 70 min (n = 6 organoids per condition). All comparisons made using a two-sample t test, accounting for equality of variances. (e, f) Calcein AM and EthD-1 staining of the off- and on-chip cardiac (e) and intestinal organoids (f) (20 × objective). (g) Viability ratios of the organoids obtained from 2 different sets of off- and on-chip experiments show no statistically significant differences (p = 0.40, non-chip = 18, and noff-chip = 15 for cardiac organoids; p = 0.36, non-chip = 8, and noff-chip = 9 for intestinal organoids). All scale bars represent 400 µm.

