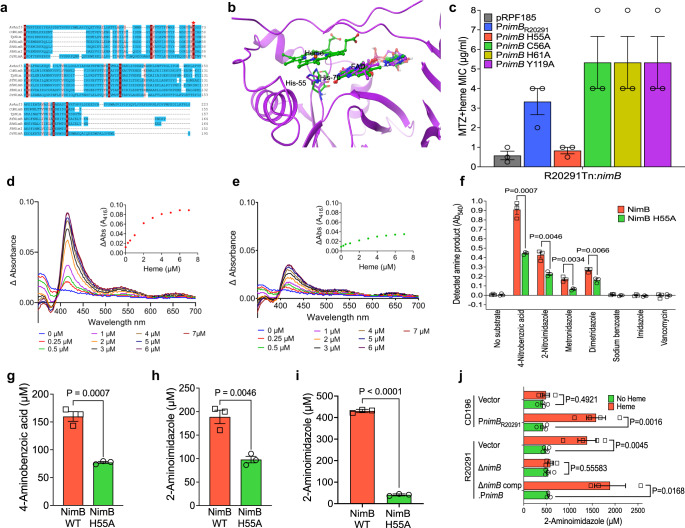
Fig. 3. CdNimB is a heme-binding nitroreductase.
a Sequence alignment of Nim proteins from C. difficile and other bacteria, with the structurally related heme binding flavocytochrome Anf3 nitrogenase from Azotobacter vinelandii (AvAnf3, accession no. 6RK0). Histidine-70 (red asterisk) is the proximal heme-binding ligand of Anf3 and is a conserved amino acid in Nim proteins e.g., histidine-55 in CdNimB. Other sequences and accession numbers are from: Tp, Terrisporobacter petrolearius WP_228108130 (https://www.ncbi.nlm.nih.gov/protein/2129663836); Bf, Bacterioides fragilis WP_063854490.1; Bh, Brachyspira hampsonii WP_039955657; Dr, Deinococcus radiodurans Q9RW27; and Pb, Prevotella baroniae ACR40098.1. b Structural alignment with Anf3 (green ball and stick), a CdNimB homology model (purple ribbons) shows close structural similarity. The CdNimB model was generated from the B. thetaiotaomicron NimB X-ray structure bound to FAD (PDB ID 2FG9) and aligned with Anf3, which has both FAD and heme bound (see Supplementary Fig. 5). The model shows CdNimB histidine-55 (purple) is structurally equivalent to histidine-70 (green) of Anf3; the FAD domains are also conserved in the two proteins. FAD and heme of Anf3 are represented as ball/stick with green carbons; the FAD of CdNimB is shown as ball/stick with purple carbons; for simplicity only histidine-70 of the Anf3 protein is shown. c Alanine mutagenesis identified histidine-55 mediates heme-dependent metronidazole resistance (MTZ). Among different alanine mutants, only His55Ala mutant did not exhibit resistance when expressed in R20291-Tn::nimB; the nimB variants were expressed in pRPF185 under PnimBG. Absorption spectra showing wildtype CdNimB (d) binds heme, but this is attenuated in the His55Ala CdNimB mutant (e). The spectra were obtained by adding increasing concentrations of heme (i.e., hemin, 1–7 µM) to 10 µM of protein (data are representative of three experimental replicates). Heme was titrated until saturation was reached, where there were no further significant changes in absorbance readings. The buffer was similarly titrated with heme and values subtracted from the protein spectral data. The insets show binding saturation curves based on the change in absorbance at 416 nm as a function of heme concentration. f Comparison of nitroreductase activities of wildtype CdNimB and Ala-55 mutant. Reduction of various nitroaromatics were tested in reaction containing CdNimB (10 μM), heme (10 μM), FAD (10 μM) and NADPH (3 mM). Reactions were incubated for 2 h, and formation of aromatic amines detected using Bratton-Marshall assay; imidazole, sodium benzoate and vancomycin were non-nitroaromatic negative controls. Corresponding assay development is shown in Supplementary Fig. 8. Data were statistically analyzed in Graphpad prism 9.4.1 by two-tailed multiple unpaired t test with correction for multiple comparisons using the Holm-Šídák method and alpha set to 0.05. Comparison of nitroreductase activities of wildtype CdNimB and His55Ala mutant, with quantification using the Bratton-Marshall assay. As shown in (g), 4-nitrobenzoic acid is reduced to 4-aminobenzoic acid, and 2-nitroimidazole is reduced to 2-aminoimidazole in (h). i LC-MS/MS quantification of 2-aminoimidazole formed from the reduction of 2-nitroimidazole in nitroreductase assays with wildtype or His55Ala CdNimBs. There are differences in relative amounts of 2-aminoimidazole quantified by the LC-MS/MS and Bratton-Marshall methods, but the results from both reached the same conclusion that the mutant is less effective in forming the amine product. j Cellular reduction of 2-nitroimidazole to 2-aminoimidazole. Concentrated cultures of various isogenic strains were treated with 2-nitroimidazole (2 mM) alone or with heme and incubated for 3 h, before 2-aminoimidazole were quantified. Plots show the mean ± standard error of mean from four replicates, except for three biological replicates for R20291ΔnimB comp.PnimB. Statistical analyses in (g)–(j) were done by two-tailed unpaired t test in Graphpad prism 9.4.1. Data in (c), (f)–(i) are from three biological replicates. Data in (d) and (e) show one of three biological replicates tested; the other two replicates behaved as shown in (d) and (e).

