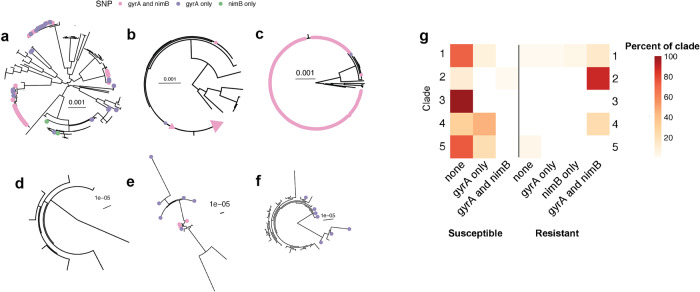
Fig. 5. Individual clade phylogenies.
Maximum-likelihood phylogenies of individual Clades 1–5 with tips colored according to gyrA and nimB SNP presence or co-occurrence from this study as well as ref. 24. a Clade 1; b Clade 2, including “global” isolates from ref. 24 and those in this study. The pink triangle represents the clonal group of which all but one have both SNPs; (c) Inset showing detail of the clonal group within Clade 2 (with one exception (blue dot; gyrA only), isolates with the gyrA mutation also encoded the nimB mutation; d Clade 3; e Clade 4; and f Clade 5. g Heat map showing SNP presence/co-occurrence and MTZ resistance phenotype frequencies within each Clade of only our sample. Each row corresponds to a single Clade. Each column presents a summary of gyrA and nimB SNP presence and MTZ resistance phenotype. Heat map is shaded by the percentage of each condition within each Clade, such that the sum across a single row is 100%. 88% of Clade 2 isolates are HMR with both gyrA and nimB SNPs, while 100% of Clade 3 isolates are MTZ susceptible and have neither SNP of interest.

