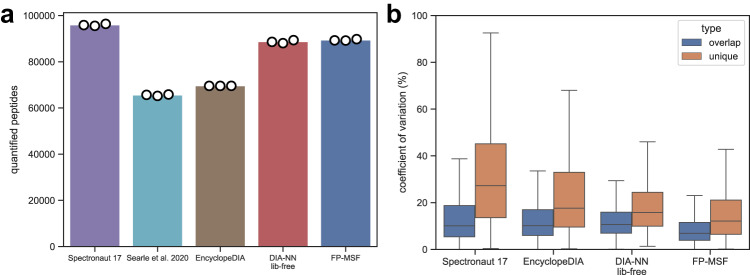
Fig. 3. Quantified peptides and coefficient of variation (CV) from the 2018-HeLa dataset.
Source data are provided as a Source Data file. a Bar plots of the quantified peptides. The bar height is the average number of three replicates. The white dots indicate the numbers from individual replicates. The results from the original publication (obtained using EncyclopeDIA version 0.8.3) are shown. We also re-analyzed the data using the latest EncyclopeDIA (version 2.12.30). b Box plots of peptide CVs. There are 3 single-shot DIA runs from 3 replicates. Blue box plots represent overlapping peptides shared among all tools, while brown box plots depict unique peptides quantified exclusively by each specific tool. The box in each box plot captures the IQR, with the bottom and top edges representing the Q1 and Q3 respectively. The median is marked by a horizontal line within the box. The whiskers extend to the minima and maxima within 1.5 times the IQR below Q1 or above Q3.

