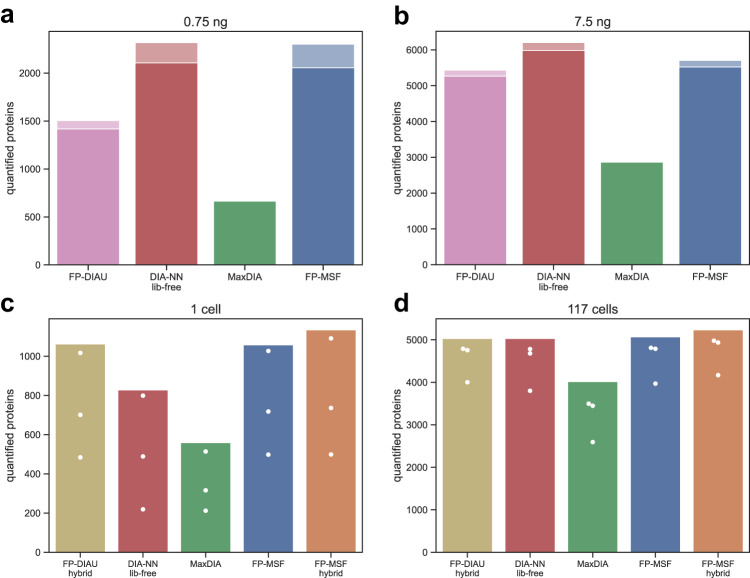
Fig. 4. The number of quantified proteins from the low-input-cell and the single-cell datasets.
Source data are provided as a Source Data file. a, b Bar plots from analyzing the low-input-cell dataset with 0.75 ng and 7.5 ng of starting material. Proteins with missing values (zero intensities) were discarded. The dark color is from the proteins with CVs less than 20%, and the light color is from the proteins with CVs greater than or equal to 20%. c, d Same as above, for the single-cell dataset, for 1 cell and for 117 cell data.

