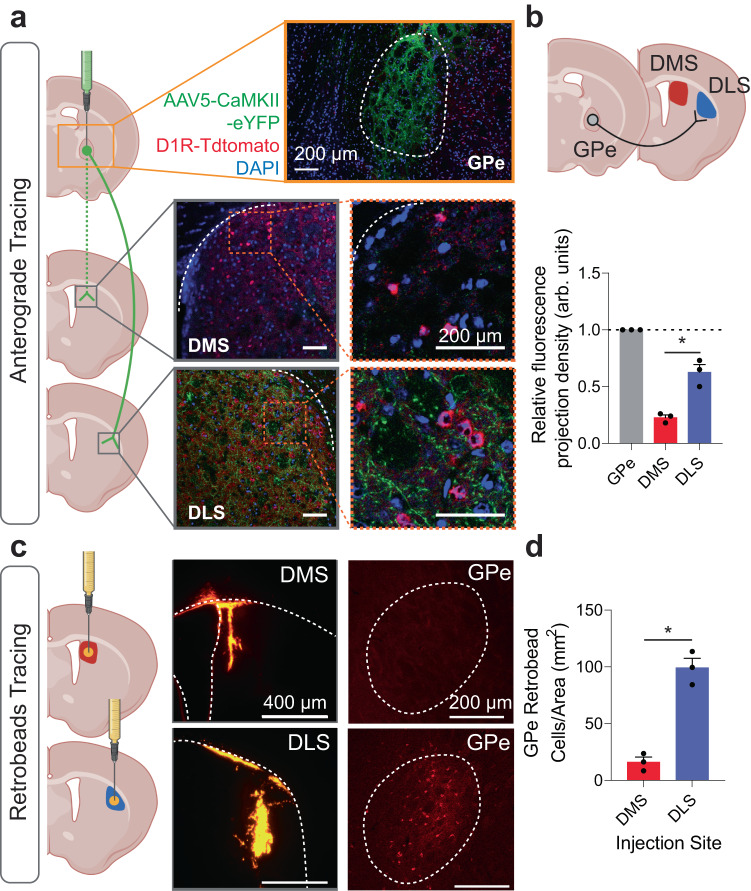
Fig. 1. Anterograde and retrograde tracing of external globus pallidus (GPe) projections.
a Injection schematic of AAV5-CaMKII-eYFP virus into the GPe in D1R-TdTomato mice and projection densities in the dorsomedial striatum (DMS) and dorsolateral striatum (DLS). Scale: 200 µm. Anterograde virus (Green), D1R (Red), DAPI (Blue). b A schematic circuit showing a majority of GPe projections target the DLS, compared to the DMS (p = 0.0012). n = 3 images/group. F(2,6) = 87.60, p < 0.0001. c Retrobead tracing of DMS and DLS afferents and representative IHC images. Scale: 400 µm (left), 200 µm (right). d DLS retrobead injections showed more GPe projection cells compared to DMS. n = 3 images/group. One-way ANOVA with Tukey’s posthoc tests were used for (c). Two-tailed t tests were used for (d). *p < 0.05. Data represent mean ± SEM. See Supplementary Table 2 for full statistical information. Source data are provided as a Source Data file. (a–c) were created with BioRender.com.

