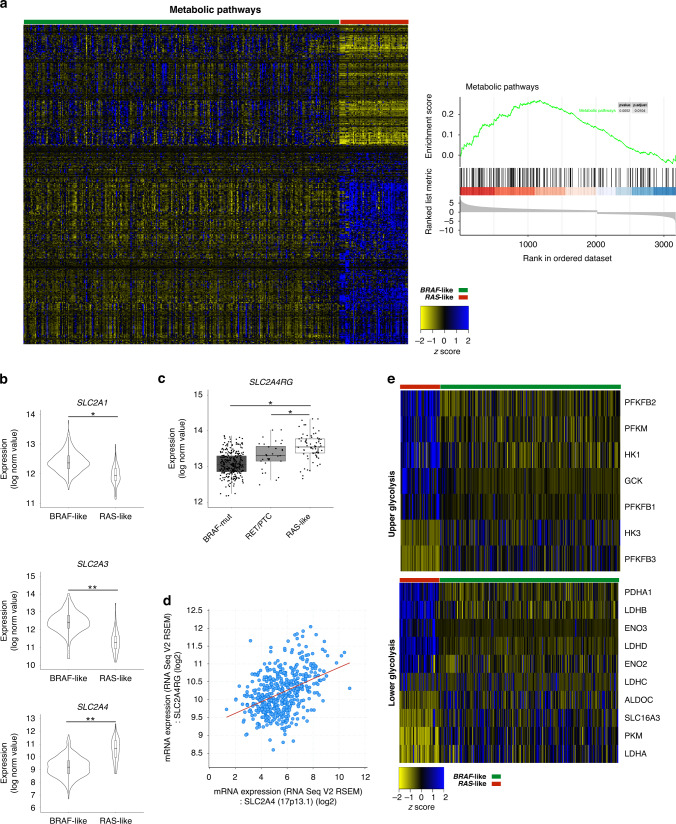
Fig. 1. BRAF-like PTC subtype displays a specific signature of metabolic genes.
a Left panel. Heatmap showing normalised expression data (RNA-Seq from THCA; n = 398) of genes flagged as “metabolism” or “metabolism-related” (PhosphoSitePlus database) in BRAF- (green) vs RAS-like (red) PTCs. Right panel. The enrichment score curve (in green) of genes belonging to the “Metabolic pathway” obtained as output of the Gene Set Enrichment Analysis (GSEA) on the genes differentially expressed (P value=0.0052; P-adjusted=0.0104) between BRAF- and RAS-like tumours (THCA cohort, TCGA). The vertical black lines indicate gene position in the ranked list, whereas horizontal bars in graded colour (upregulated in red; downregulated in blue) indicate the rank-ordered, non-redundant list of genes. b Violin plots illustrating normalised expression values (log2 scale) of SLC2A1, SLC2A3 and SLC2A4 – encoding glucose transporters —in BRAF- (n = 327) and RAS-like (n = 71) PTCs (THCA cohort). *FDR ≤ 0.05, **FDR ≤ 0.01, ***FDR ≤ 0.001. c Box plots displaying normalised expression values (log2 scale) of SLC2A4RG—encoding the main transcription regulator of Glut4—in BRAF-like (BRAFV600E and RET/PTC) and RAS-like tumours. *FDR ≤ 0.05. d Scatter plot of normalised expression data (log2 scale) showing the correlation trend between SLC2A4 and SLC2A4RG overall THCA cohort (generated in cBioPortal); Spearman’s correlation: 0.39 (P = 3.98e-19), Pearson’s correlation: 0.41 (P = 3.01e-21). e Heatmaps showing normalised expression data of genes involved in upper and lower glycolysis in the BRAF- (green) vs RAS-like (red) PTCs.

