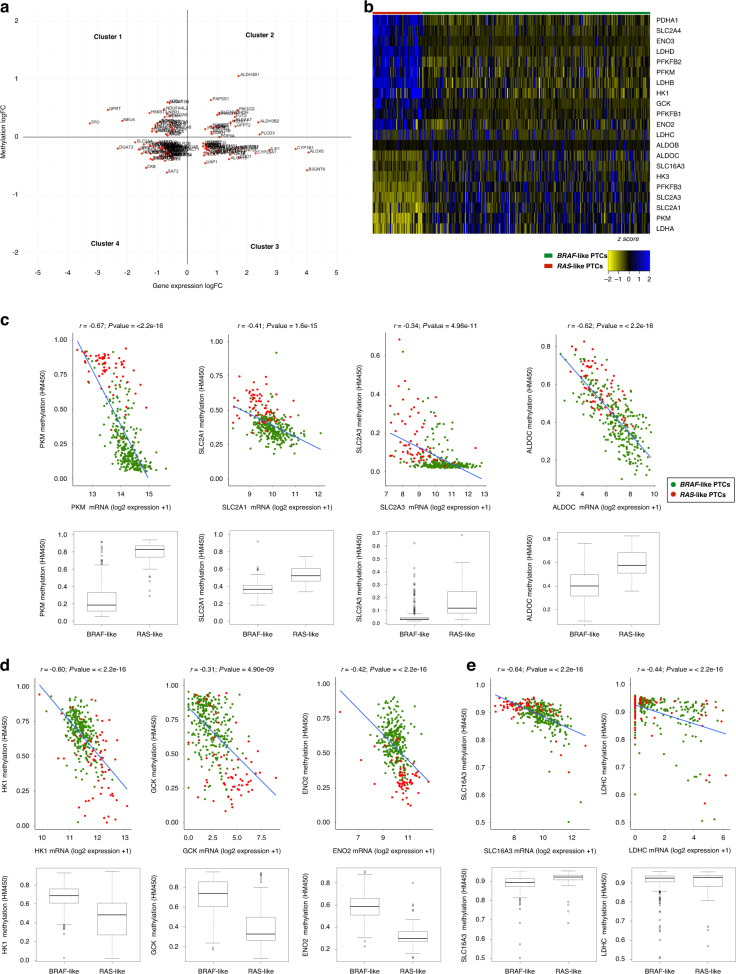
Fig. 2. PTC subtypes do not display marked differences in DNA methylation of glucose transporters and glycolytic genes.
a Scatter plot of expression and methylation data (logFC; THCA datasets) of genes differentially expressed between BRAF- and RAS-like PTCs. Four distinct clusters of genes have been identified (clockwise from upper left) as altered in BRAF-like tumours: hypermethylated and downregulated (cluster 1); hypermethylated and overexpressed (cluster 2); hypomethylated and overexpressed (cluster 3); hypomethylated and downregulated (cluster 4). b Heatmap showing normalised expression data (RNA-Seq datasets from THCA cohort; n = 398) of genes encoding glucose transporters and glycolysis-related proteins (selected according to KEGG database) in BRAF- (green) vs RAS-like (red) PTCs. c–e Scatter plots showing the correlation—by linear regression analysis—between normalised expression (log2 scale) and methylation data (logFC; THCA cohort) of 9 selected genes differentially expressed between PTC subtypes. These genes were selected as showing a good (0.30 > r < 0.49) or strong (0.5 > r < 0.7) correlation (Pearson’s coefficient) and distinguished in significantly hypomethylated and overexpressed (c), hypermethylated and downregulated in BRAF-like subtype (d) and highly correlated, but not differentially methylated, between tumour subtypes (e).

