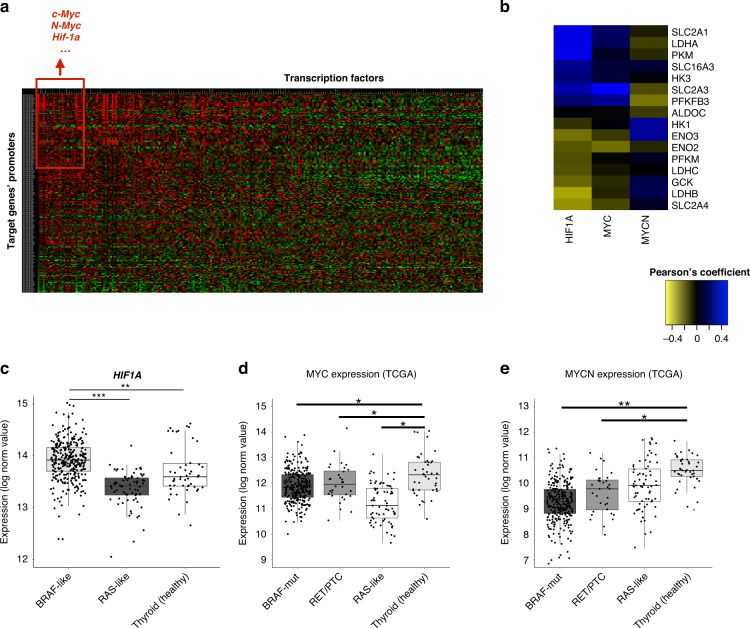
Fig. 3. Identification of transcription factors potentially contributing to the metabolic rewiring in BRAF-like PTCs.
a Heatmap showing the enrichment of predicted transcription factors’ binding sites in the putative promoters (window of 1 kb up- and downstream the transcription start site, TSS) of metabolic genes differentially expressed between BRAF- and RAS-like PTCs. Red squares indicate higher enrichment scores for TFs’ predicted binding. b Heatmap showing Pearson’s coefficients between the expression values of top-ranked TFs—having the highest number of predicted binding sites in the promoter of metabolic genes—and the glucose transporters and other glycolytic genes differentially expressed between BRAF- and RAS-like PTCs (THCA cohort). c Box plot comparing normalised HIF1A expression values (log2 scale) in BRAF-, RAS-like PTCs and in healthy thyroid samples. ***FDR ≤ 0.001. d, e Box plots comparing normalised MYC (D) and MYCN (E) expression values (log2 scale) in BRAF-mutated, RET/PTC, RAS-like PTCs and in healthy thyroid samples (THCA cohort). *FDR ≤ 0.05, **FDR ≤ 0.01.

