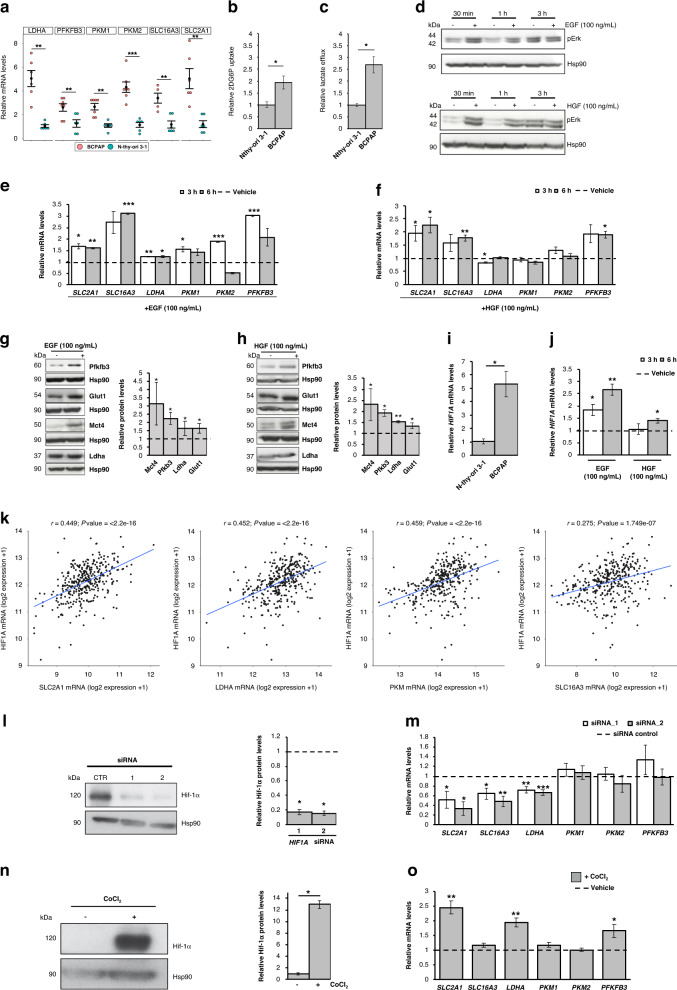
Fig. 4. BRAF-mutated PTC cells display a glycolytic phenotype mediated by Hif-1α.
a Relative mRNA quantification (qPCR) of selected metabolic genes in BCPAP compared to normaloid thyroid cell line (Nthy-ori 3-1). Data are reported as mean ± SEM vs Nthy-ori 3-1 cells of at least six independent experiments. PPIA was used as reference gene. **P value ≤0.01 and ***P value ≤0.001. b Relative colorimetric detection of 2-DG6P uptake in BCPAP compared to Nthy-ori 3-1 cells. Corrected values (pmol) were normalised for the related AUC and data are reported as mean ± SEM of at least four independent experiments. *P value ≤ 0.05. c Relative colorimetric detection of l-lactic acid content in the cell culture supernatant of BCPAP compared to Nthy-ori 3-1 cells. Lactate concentration (mmol/L) was normalised for the related AUC and data are reported as mean ± SEM of at least four independent experiments. *P value ≤0.05. d Representative autoradiographs of the western blot analysis for pErk in Nthy-ori 3-1 treated or not with Egf (upper panel) or Hgf (lower panel) 100 ng/mL at multiple time points. Hsp90 was used as a loading control. e, f Relative mRNA quantification (qPCR) of selected metabolic genes in Nthy-ori-3-1 cells upon EGF (100 ng/mL; e) and HGF (100 ng/mL; f) treatment (3, 6 h). Data are reported as mean ± SEM vs control cells (vehicle-treated; dotted line) of three independent experiments. PPIA was used as reference gene. *P value ≤0.05, **P value ≤0.01 and ***P value ≤0.001. g, h Representative autoradiographs of the western blot analysis for selected metabolic enzymes and transporters (i.e., Pfkfb3, Glut1, Mct4 and Ldha) in Nthy-ori 3-1 treated or not with EGF (g) or HGF (h) 100 ng/mL at multiple time points. Hsp90 was used as a loading control. Bar graphs (right part of each panel) report relative protein levels normalised on Hsp90 expression (pixel density analysis of western blots). Data are reported as mean ± SEM vs control cells (i.e., treated with the vehicle) of three independent experiments. *P value ≤0.05, **P value ≤0.01. i, j Relative mRNA quantification (qPCR) of HIF1A gene in BCPAP vs Nthy-ori 3-1 (i) and in BCPAP treated with EGF and HGF (100 ng/Ml, j) for 3 and 6 h vs control cells (i.e., treated with the vehicles; dotted line). Data are reported as mean ± SEM of three independent experiments. PPIA was used as a reference. *P value ≤0.05 and **P value ≤0.01. k Scatter plot of normalised expression data (log2 scale) showing the correlation—by linear regression analysis—of HIF1A and selected glycolysis-related genes in THCA cohort (expression data downloaded from cBioPortal). Pearson correlation coefficient (r) and P value (P) are shown. l Representative autoradiographs of western blot analysis (left panel) of Hif-1α protein levels in BCPAP transfected with two different HIF1A siRNAs. Hsp90 was used as a loading control. Bar graphs (right panel) report relative Hif-1α levels normalised on Hsp90 expression (pixel density analysis of western blots). Data are reported as mean ± SEM vs control cells (i.e., BCPAP transfected with scrambled siRNAs; dotted line) of three independent experiments. *P value ≤0.05. m Relative mRNA quantification (qPCR) of selected metabolic genes upon HIF1A silencing in BCPAP. Data are reported as mean ± SEM vs control cells (scrambled siRNAs; dotted line) of at least three independent experiments. PPIA was used as reference. *P value ≤0.05, **P value ≤0.01 and ***P value ≤0.001. n Representative autoradiographs of western blot analysis (left panel) of Hif-1α protein levels in BCPAP treated with CoCl2 (250 µM, 24 h). Hsp90 was used as a loading control. Bar graphs (right panel) report relative Hif-1α levels normalised on Hsp90 expression (pixel density analysis of western blots). Data are reported as mean ± SEM vs control cells (i.e., treated with the vehicle) of three independent experiments. *P value ≤0.05. o Relative mRNA quantification (qPCR) of selected metabolic genes in BCPAP treated with CoCl2 (250 µM, 24 h). Data are reported as mean ± SEM vs control cells (BCPAP treated with the vehicle; dotted line) of at least four independent experiments. PPIA was used as a reference. *P value ≤0.05 and **P value ≤0.01.

