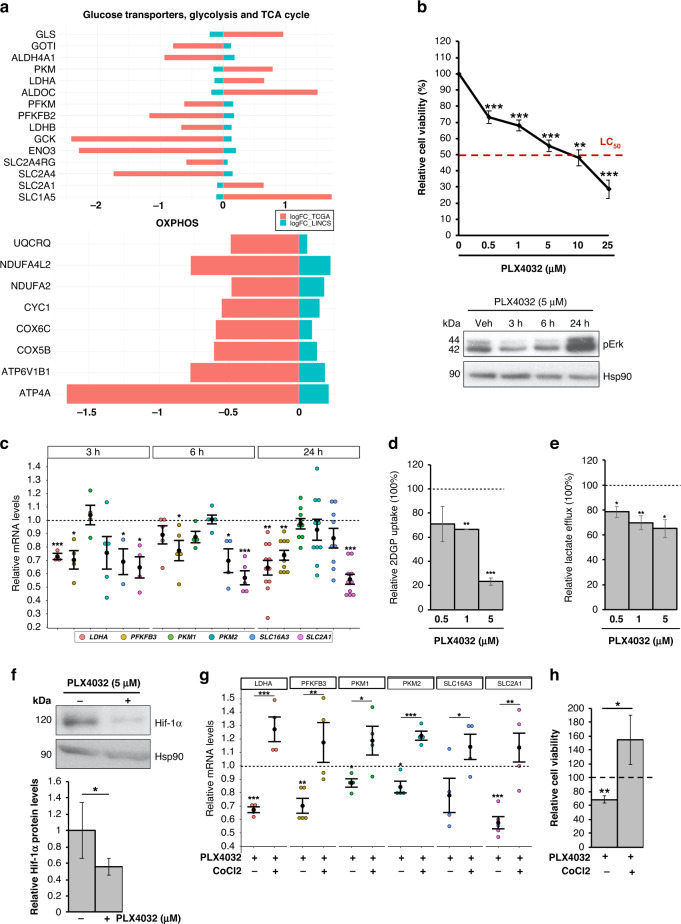
Fig. 5. BRAFi counteract the glycolytic phenotype and Hif-1α-modulated transcription signature of BRAF-mutant PTC cells.
a Bar graphs indicate the expression levels (logFC) of genes involved in energy metabolism—i.e., glucose transport, glycolysis, TCA cycle (upper panel) and OXPHOS (lower panel)—and differentially expressed between BRAF- and RAS-like tumours, whose expression is reverted upon treatment with vemurafenib (blue bars) in multiple BRAF-mutated tumour cell lines from the LINCS 1000 Project. TCGA data (THCA cohort) for the same genes are indicated as red bars (logFC). b Relative cell viability (percentage; upper panel) in BCPAP cells upon treatment with PLX4032 treatment (0.5, 1, 5, 10 and 25 µM)—a vemurafenib analogue—for 72 h. Red dotted line indicates the median lethal concentration (lethal concentration 50%, LC50). Data are reported as mean ± SEM vs control cells (i.e., BCPAP treated with Veh; set to 100% of viability) of at least four independent experiments. **P value ≤0.01 and ***P value ≤0.001. Representative autoradiographs (lower panel) of western blot analysis of Erk phosphorylation (i.e., pErk) levels in BCPAP treated with PLX4032 (5 µM; 3, 6 and 24 h). Hsp90 was used as a loading control. c Relative mRNA quantification (qPCR) of selected metabolic genes in BCPAP treated with PLX4032 (5 µM; 3, 6 and 24 h). Data are reported as mean ± SEM vs control cells (i.e., treated with the vehicle; dotted line) of at least four independent experiments. *P value ≤0.05, **P value ≤0.01 and ***P value ≤0.001. d Relative colorimetric detection of total 2-DG6P uptake in BCPAP treated with different concentrations of PLX4032 for 72 h. Corrected values (pmol) were normalised for the related AUC and data are reported as mean ± SEM of at least three independent experiments. The effect of each treatment was estimated as the percentage of glucose uptake of control cells (i.e., BCPAP treated with the vehicle, set to 100%; dotted line). **P value ≤0.01 and ***P value ≤0.01. e Relative colorimetric detection of l-lactic acid content in cell culture supernatant of BCPAP treated with different concentrations of PLX4032 for 72 h. Lactate concentration (mmol/L) was normalised for the related AUC and data are reported as mean ± SEM of at least four independent experiments. The effect of each treatment was estimated as the percentage of lactate secreted by control cells (i.e., BCPAP treated with the vehicle, set to 100%; dotted line). *P value ≤0.05 and **P value ≤0.01. f Representative autoradiographs of western blot analysis (upper panel) of Hif-1α protein levels in BCPAP treated with PLX4032 (5 µM; 24 h). Hsp90 was used as a loading control. Bar graphs (lower panel) report relative Hif-1α levels normalised on Hsp90 expression (pixel density analysis of western blots). Data are reported as mean ± SEM vs control cells (i.e., BCPAP treated with the vehicle) of three independent experiments. *P value ≤ 0.05. g Relative mRNA quantification (qPCR) of selected metabolic genes in BCPAP upon PLX4032 treatment (5 µM) alone—vs cells treated with the vehicle—or in combination with CoCl2 (125 µM)—vs cells treated with CoCl2 alone—for 24 h. Data are reported as mean ± SEM vs control cells (dotted line) of at least four independent experiments. PPIA was used as reference. *P value ≤0.05, **P value ≤0.01 and ***P value ≤0.001. h Relative cell viability in BCPAP upon PLX4032 treatment (5 µM) alone—vs cells treated with the vehicle—or in combination with CoCl2 (125 µM)—vs cells treated with CoCl2 alone—for 72 h. Data are reported as mean ± SEM vs control cells (dotted line, set to 100% of viability) of four independent experiments. *P value ≤0.05 and **P value ≤0.01.

