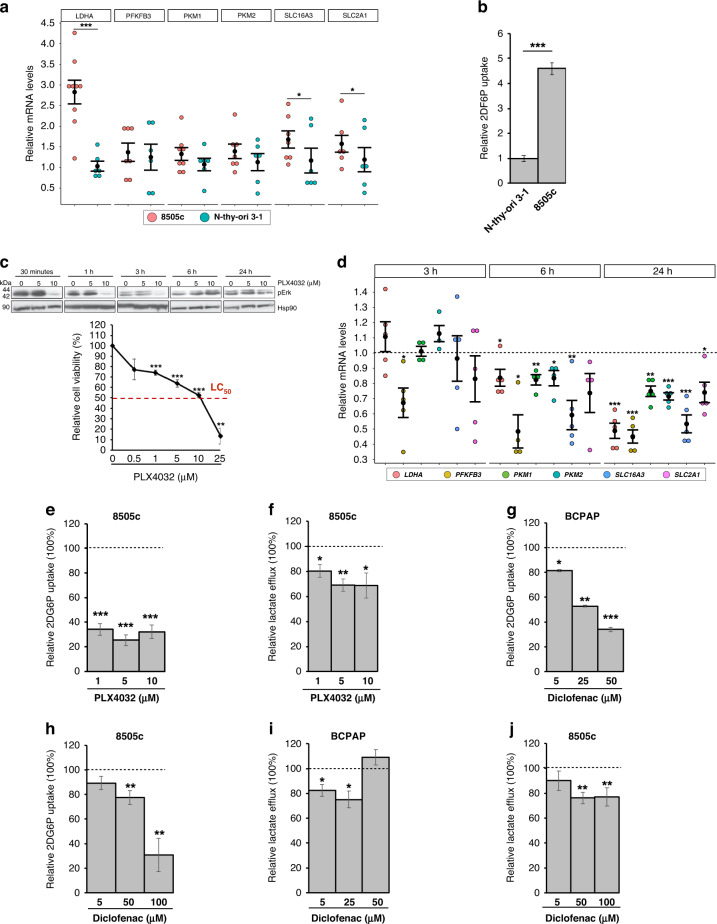
Fig. 6. BRAF-mutated PTC and ATC cells display a similar glycolytic phenotype modulated by BRAFi and diclofenac.
a Relative mRNA quantification (qPCR) of selected metabolic genes in 8505c compared to Nthy-ori 3-1. Data are reported as mean ± SEM vs Nthy-ori 3-1 cells of at least six independent experiments. PPIA was used as reference. *P value ≤0.05 and ***P value ≤0.001. b Relative colorimetric detection of total 2-DG6P uptake in 8505c compared to Nthy-ori 3-1 cells. Corrected values (pmol) were normalised for the related AUC and data are reported as mean ± SEM of at least four independent experiments. ***P value ≤0.01. c Representative autoradiographs of western blot analysis (upper panel) of Erk phosphorylation (i.e., pErk) levels in 8505c cells treated with PLX4032 (5 µM and 10 µM; 30 min, 1, 3, 6 and 24 h). Hsp90 was used as a loading control. Relative cell viability (percentage; lower panel) in 8505c cells upon treatment with PLX4032 treatment (0.5, 1, 5, 10 and 25 µM)—a vemurafenib analogue—for 72 h. Red dotted line indicates the median lethal concentration (lethal concentration 50%, LC50). Data are reported as mean ± SEM vs control cells (i.e., BCPAP treated with the vehicle; set to 100% of viability) of at least four independent experiments. **P value ≤0.01, ***P value ≤0.001. d Relative mRNA quantification (qPCR) of selected metabolic genes in 8505c treated with PLX4032 (10 µM; 3, 6 and 24 h). Data are reported as mean ± SEM vs control cells (i.e., 8505c treated with the vehicle; dotted line) of at least four independent experiments. *P value ≤0.05, **P value ≤0.01 and ***P value ≤0.001. e Relative colorimetric detection of total 2-DG6P uptake in 8505c treated with different concentrations of PLX4032 for 72 h. Corrected values (pmol) were normalised for the related AUC and data are reported as mean ± SEM of at least four independent experiments. The effect of each treatment was estimated as the percentage of glucose uptake of control cells (i.e., 8505c treated with the vehicle, set to 100%; dotted line). **P value ≤0.01 and ***P value ≤0.01. f Relative colorimetric detection of l-lactic acid content in cell culture supernatant of 8505c treated with different concentrations of PLX4032 for 72 h. Lactate concentration (mmol/L) was normalised for the related AUC and data are reported as mean ± SEM of at least four independent experiments. The effect of each treatment was estimated as the percentage of lactate secreted by control cells (i.e., 8505c treated with the vehicle, set to 100%; dotted line). *P value ≤0.05 and **P value ≤0.01. g, h Relative colorimetric detection of total 2-DG6P uptake in BCPAP (g) and 8505c (h) treated with different concentrations of diclofenac for 72 h. Corrected values (pmol) were normalised for the related AUC and data are reported as mean ± SEM of at least three independent experiments. The effect of each treatment was estimated as the percentage of glucose uptake of control cells (i.e., cells treated with the vehicle, set to 100%; dotted line). *P value ≤0.05, **P value ≤0.01 and ***P value ≤ 0.01. i, j Relative colorimetric detection of l-lactic acid content in cell culture supernatant of BCPAP (i) and 8505c (j) treated with different concentrations of diclofenac for 72 h. Lactate concentration (mmol/L) was normalised for the related AUC and data are reported as mean ± SEM of at least four independent experiments. The effect of each treatment was estimated as the percentage of lactate secreted by control cells (i.e., cells treated with the vehicle, set to 100%; dotted line). *P value ≤0.05 and **P value ≤0.01.

