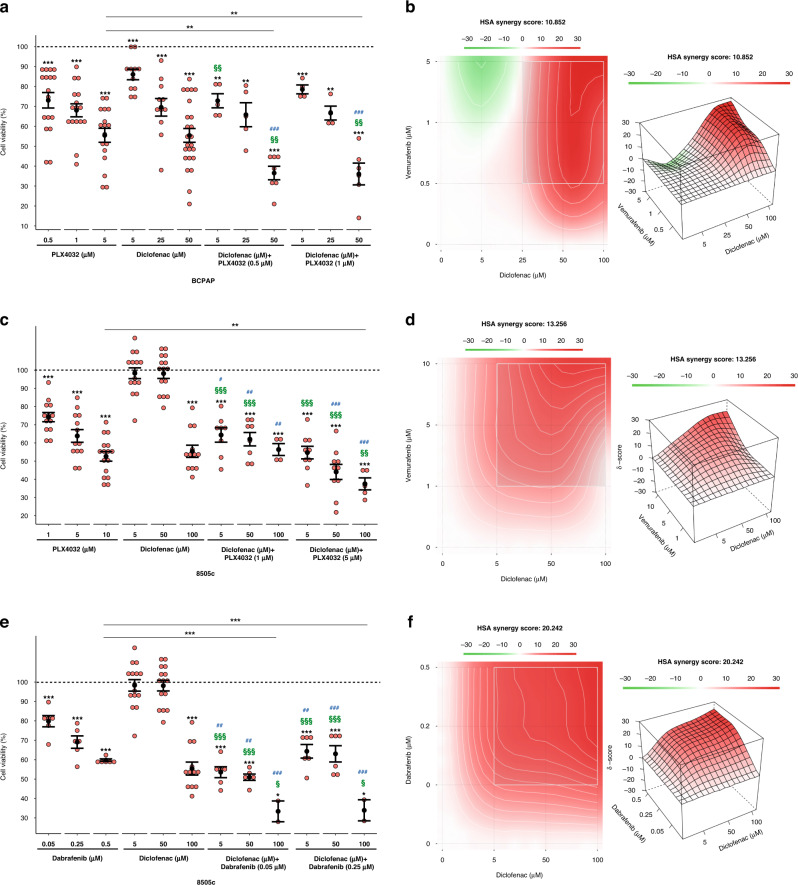
Fig. 7. The combination of BRAFi and diclofenac synergistically reduces the cell viability of BRAF-mutated PTC and ATC cells.
a Relative cell viability in BCPAP cells upon single (PLX4032 and diclofenac) and combined treatment with the two drugs at different doses for 72 h. Data are reported as mean ± SEM vs control cells (i.e., BCPAP treated with the vehicles—indicated as dotted line—are set to 100% of viability) of at least four independent experiments. **P value ≤0.01 and ***P value ≤0.001 vs control cells or BCPAP treated with the maximum dose of PLX4032 (5 µM). ###P value ≤0.001 vs BCPAP treated with the same doses of PLX4032 alone. §§P value ≤ 0.01 vs BCPAP treated with the same doses of diclofenac alone. b Heatmap showing—in 2D (left panel) and 3D (right panel)—the HSA synergy scores (i.e., positive values in red denote synergy), analysed by SynergyFinder tool, for the combination of PLX4032 and diclofenac in BCPAP. c Relative cell viability in 8505c cells upon single (PLX4032 and diclofenac) and combined treatment with the two drugs at different doses for 72 h. Data are reported as mean ± SEM vs control cells (i.e., 8505c treated with the vehicles—indicated as dotted line—are set to 100% of viability) of at least four independent experiments. ***P value ≤0.001 vs control cells or 8505c treated with the maximum dose of PLX4032 (10 µM). #P value ≤0.05, ##P value ≤0.01 and ###P value ≤0.001 vs 8505c treated with the same doses of PLX4032 alone. §§P value ≤0.01 and §§§P value ≤0.01 vs 8505c treated with the same doses of diclofenac alone. d Heatmap showing—in 2D (left panel) and 3D (right panel)—the HSA synergy scores (i.e., positive values in red denote synergy), analysed by SynergyFinder tool, for the combination of PLX4032 and diclofenac in 8505c. e Relative cell viability in 8505c cells upon single (dabrafenib or diclofenac) and combined treatment with the two drugs at different doses for 72 h. Data are reported as mean ± SEM vs control cells (i.e., 8505c treated with the vehicles—indicated as dotted line—are set to 100% of viability) of at least three independent experiments. *P value ≤0.05 and ***P value ≤0.001 vs control cells or 8505c treated with the maximum dose of DBR (0.5 µM). ##P value ≤0.01 and ###P value ≤0.001 vs 8505c treated with the same doses of dabrafenib alone. §P value ≤0.05 and §§§P value ≤0.01 vs 8505c treated with the same doses of diclofenac alone. f Heatmap showing—in 2D (left panel) and 3D (right panel)—the HSA synergy scores (i.e., positive values in red denote synergy), analysed by SynergyFinder tool, for the combination of dabrafenib and diclofenac in 8505c.

