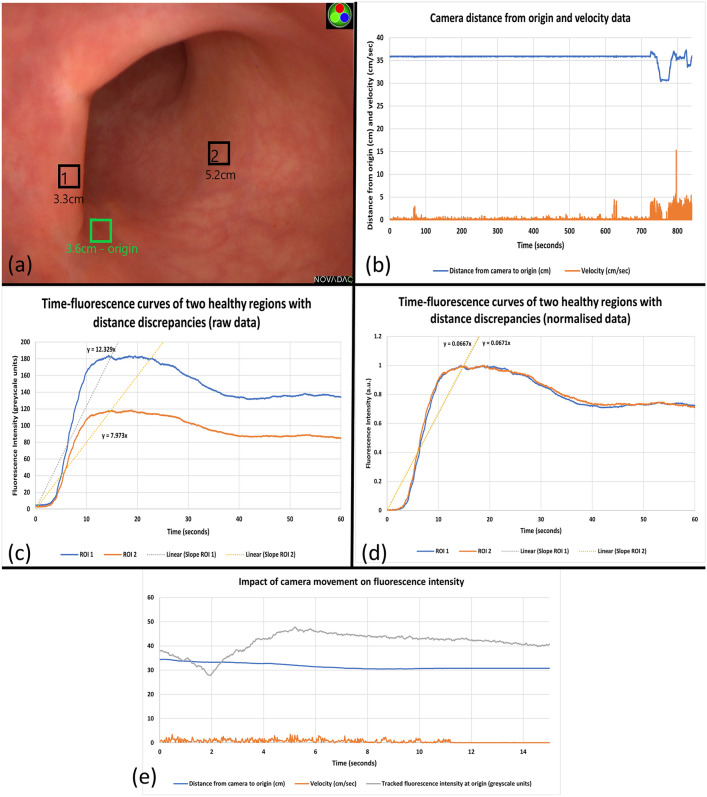
Fig. 3.
Distance, intensity and velocity data generated using an electromagnetic tracking system with its sensor probe attached to the tip of the camera and introduced into the patient with a rectal cancer following neoadjuvant therapy via a transanal access platform during examination under anaesthesia (EUA). (a) White light view of the rectum with regions of interest and their calculated distance to the camera tip displayed. (b) Distance, movement and velocity data of camera movement during the EUA and subsequent ICG assessment (note camera held with robotic camera holder until ≈720 s. (c) Raw time–fluorescence data achieved via tracking pixel intensity data of the regions indicated in the white light image with slope to peak intensities shown. (d) Appearance of these same regions after normalisation of intensity and upslope re-analysis. (e) Impact of camera movement on tracked fluorescence intensity showing rapid increase in detected fluorescence with inward movement of the camera toward the target tissue

