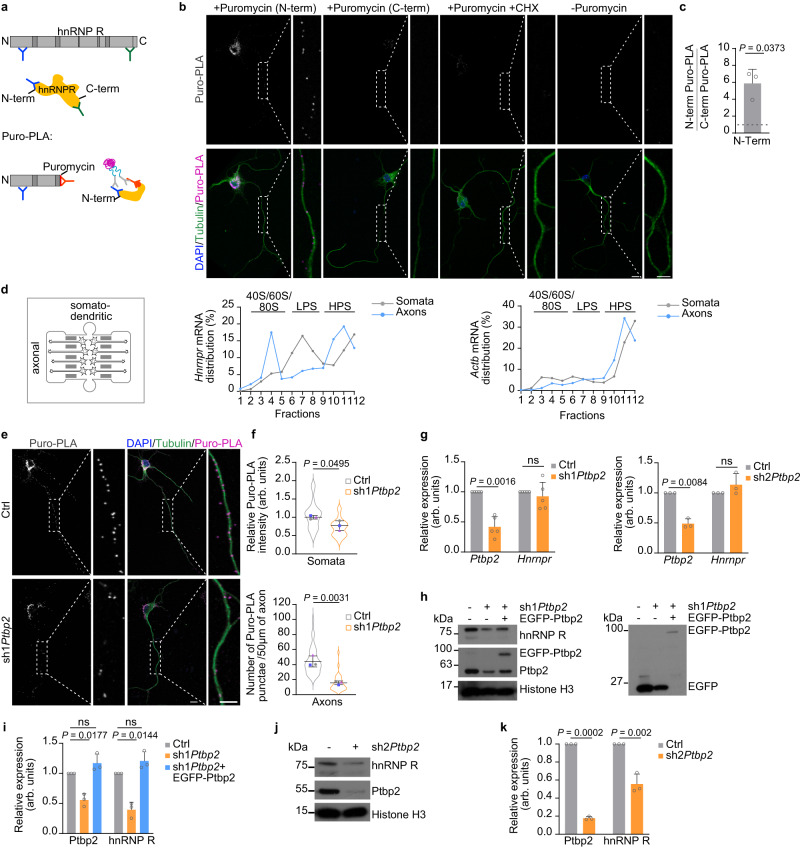
Fig. 5. Ptbp2 regulates the axonal translation of Hnrnpr mRNA in motoneurons.
a Schematic representing the binding sites for anti-hnRNP R antibodies targeted against the N- and C-terminus (blue and green, respectively). In Puro-PLA experiments, close proximity between an N-terminal hnRNP R antibody and an anti-puromycin antibody (orange) allows signal amplification. b Representative images of Puro-PLA signal in cultured motoneurons at DIV 7 using either N-terminal (N-term) or C-terminal (C-term) anti-hnRNP R antibodies. Labeling without puromycin or with puromycin in the presence of cycloheximide (CHX) was used as controls. Boxed regions are magnified to the right of each image. Motoneurons were immunostained for Tubulin to visualize their morphology and nuclei were labeled with DAPI. Scale bars, 10 µm and 5 µm (magnified areas). The images are representative of three biological replicates. c Ratio of Puro-PLA signal obtained with an N-terminal anti-hnRNP R antibody to Puro-PLA with a C-terminal antibody. Two-tailed one-sample t-test. Data are mean ± s.d. of n = 3 biological replicates. d Relative levels of Hnrnpr and Actb as a control in fractions of somatodendritic and axonal lysate subjected to sucrose density gradient ultracentrifugation. Data are mean of n = 2 biological replicates. e Puro-PLA of hnRNP R of control and Ptbp2-depleted motoneurons. Scale bars, 10 µm and 5 µm (magnified areas). f Quantification of relative Puro-PLA intensity in somata and the number of Puro-PLA punctae in 50 µm of axons of control and Ptbp2 knockdown motoneurons. Unpaired two-tailed Student’s t test. Data are mean ± s.d. of n = 3 biological replicates. g Quantification of Hnrnpr and Ptbp2 mRNA levels by qPCR in control and Ptbp2-depleted motoneurons at DIV 6. 18S rRNA was used as housekeeping transcript. Two-tailed one-sample t test. Data are mean ± s.d. of n = 5 (sh1Ptbp2) and n = 3 (sh2Ptbp2) biological replicates. h Immunoblot analysis of hnRNP R and Ptbp2 in control, Ptbp2-depleted and rescued motoneurons at DIV 6. Histone H3 was used as a loading control. i Quantitative analysis of Western blots as shown in (h) for Ptbp2 and hnRNP R. Two-tailed one-sample t test. Data are mean ± s.d. of n = 3 biological replicates. j Immunoblot analysis of hnRNP R and Ptbp2 in control and Ptbp2-depleted motoneurons. k Quantitative analysis of Western blots as shown in (j) for Ptbp2 and hnRNP R. Two-tailed one-sample t test. Data are mean ± s.d. of n = 3 biological replicates. Source data are provided as a Source Data file.

