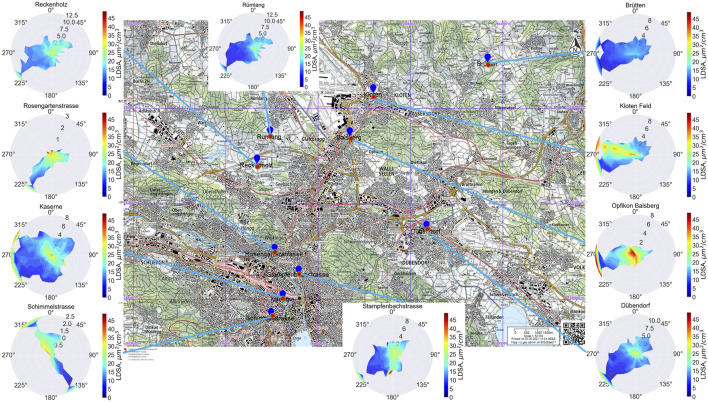
FIGURE 2.
Pollution roses at the sampling locations showing the distribution of hourly lung-deposited surface area concentration (LDSA) with wind direction and speed (m/s) for the second campaign from 2021 to 2022. The colourmap scale goes from 0 (dark blue) to 50 (dark red) μm2/cm3. 30 wind speed bins were used. The base map was obtained from the Swiss Federal Geo portal [geo.admin.ch, scale: 1:50,000 (m)] (Zurich, Switzerland. 2022).

