
FIGURE 3.
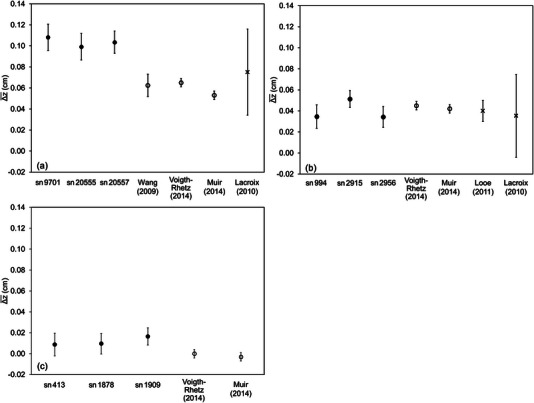
Comparison of the for different serial numbers: (a) NACP‐02; (b) Roos; (c) Advanced Markus. This finding is the mean of all energies for each serial number. The values reported in previous studies are shown as calculated via the Monte Carlo (MC) simulation (circles) and experimentally determined (crosses). The error bars in this study show 1σ, whereas previous studies based on MC simulation show statistical uncertainties. Wang and Muir's findings for NACP‐02 are plotted based on the specifications.