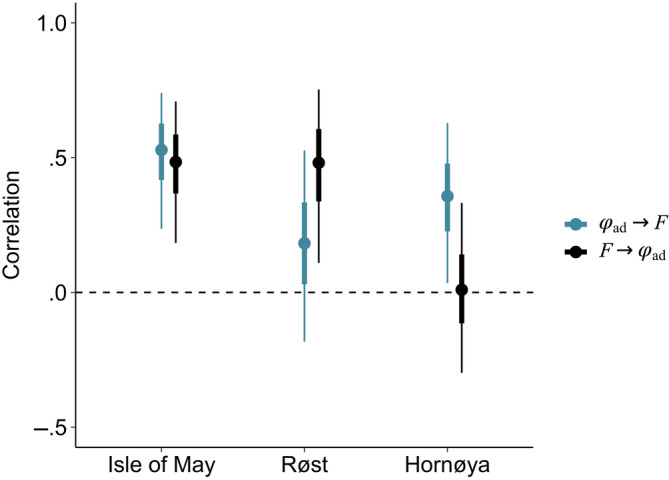
FIGURE 3.

Correlation (mean and 95% credible intervals) between survival prior to the breeding season (t−1 → t) and productivity at year t (ϕad, t−1 → t → F t , in blue) and the correlation between productivity (t) and adult survival to the subsequent breeding season (t → t + 1) (F t → ϕad, t → t+1, black) for populations; Isle of May, Røst and Hornøya.
