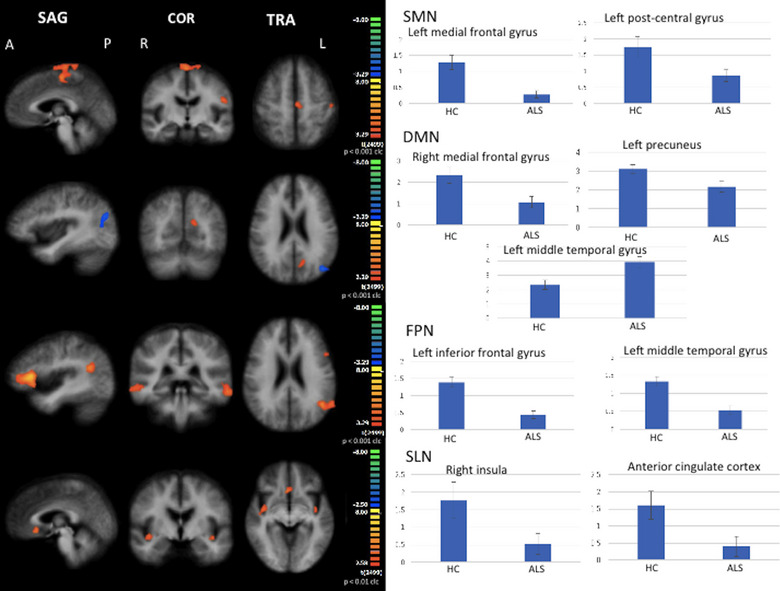
FIGURE 2.

RSNs between‐group comparisons Functional connectivity (FC) signal fluctuations in ALS patients versus healthy controls (HC) in the sensorimotor network (SMN), in the default mode network (DMN), in the right and left frontoparietal networks (FPN), and in the salience network (SLN) (on the left, maps: right‐yellow scale for FC decrease, blue scale for FC increase; on the right, bar plots of the average FC levels). A = anterior; clc = cluster‐level corrected; COR = coronal; L = left; P = posterior; R = right; SAG = sagittal; TRA = transverse.
