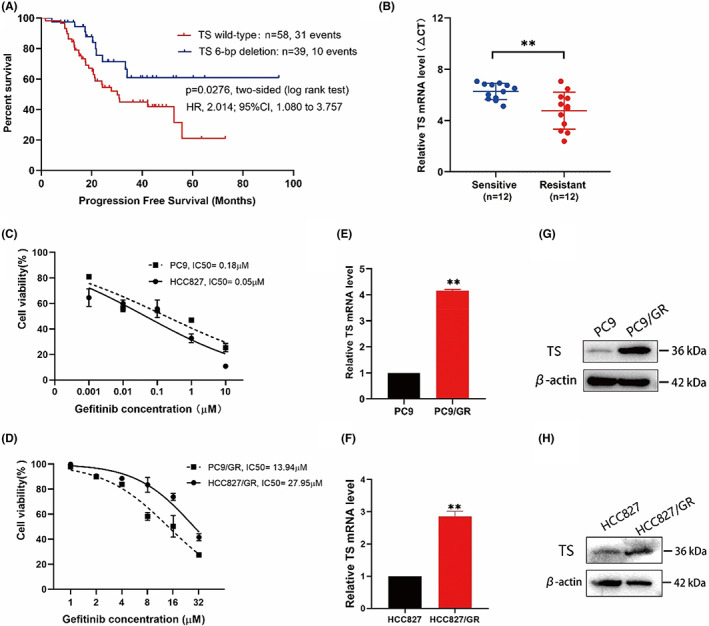
FIGURE 2.

High expression of TS is correlated with efficacy of EGFR‐TKI therapy. (A), Kaplan–Meier survival analysis of PFS in 97 LUAD patients accepting EGFR‐TKI treatment, comparison of the TS wild‐type group and the 6‐bp deletion group. (B), TS expression in NSCLC tissues from NSCLC patients who had never been administered gefitinib (sensitive group) compared to patients who developed resistance during gefitinib treatment (resistant group). The TS expression level in two groups was measured using qPCR and normalized to GAPDH expression. The ΔCt value was calculated by subtracting the GAPDH Ct value from the TS Ct value. Smaller ΔCt values represent higher TS mRNA levels. (C), the IC50 value of gefitinib in PC9 and HCC827 cells. (D), the IC50 value of gefitinib in PC9/GR and HCC827/GR cells. (E, F), qRT–PCR showing the mRNA expression of TS in sensitive and resistant cells. (G, H), the protein level of TS in sensitive and resistant cells. The results represented the average of three independent experiments. **p < 0.01.
