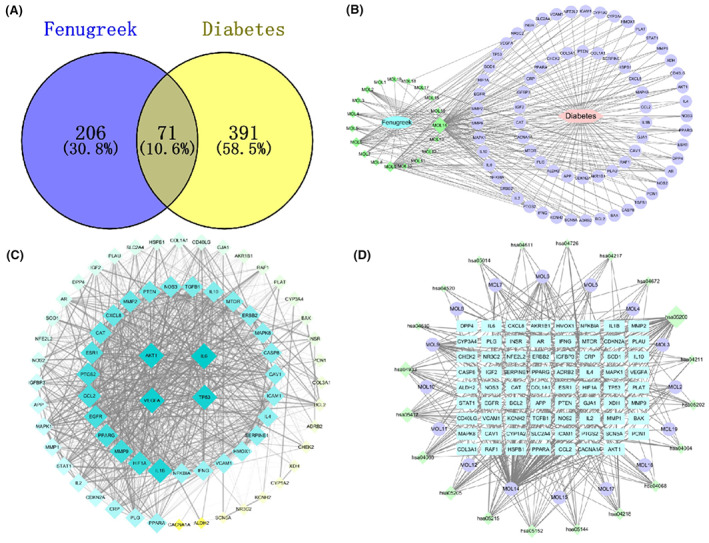
FIGURE 2.

Network pharmacology analyse results. (A) Venn diagram of fenugreek–diabetes targets. (B) Drug‐Compound‐Target‐Disease interaction network. Green diamonds are active compounds, the pink hexagon is the disease, purple circles are the common target genes of the compounds and the disease and the lines represent interactions between compounds and targets. (C) PPI network of the common target genes. Diamonds represent proteins, the colours (from blue to green to yellow) indicate the degree of binding between proteins and the lines represent protein‐protein interactions. (D) Compound‐Gene‐Pathway network. Blue rectangles represent hub genes, purple circles represent active compounds and green diamonds indicate pathways associated with the core targets.
