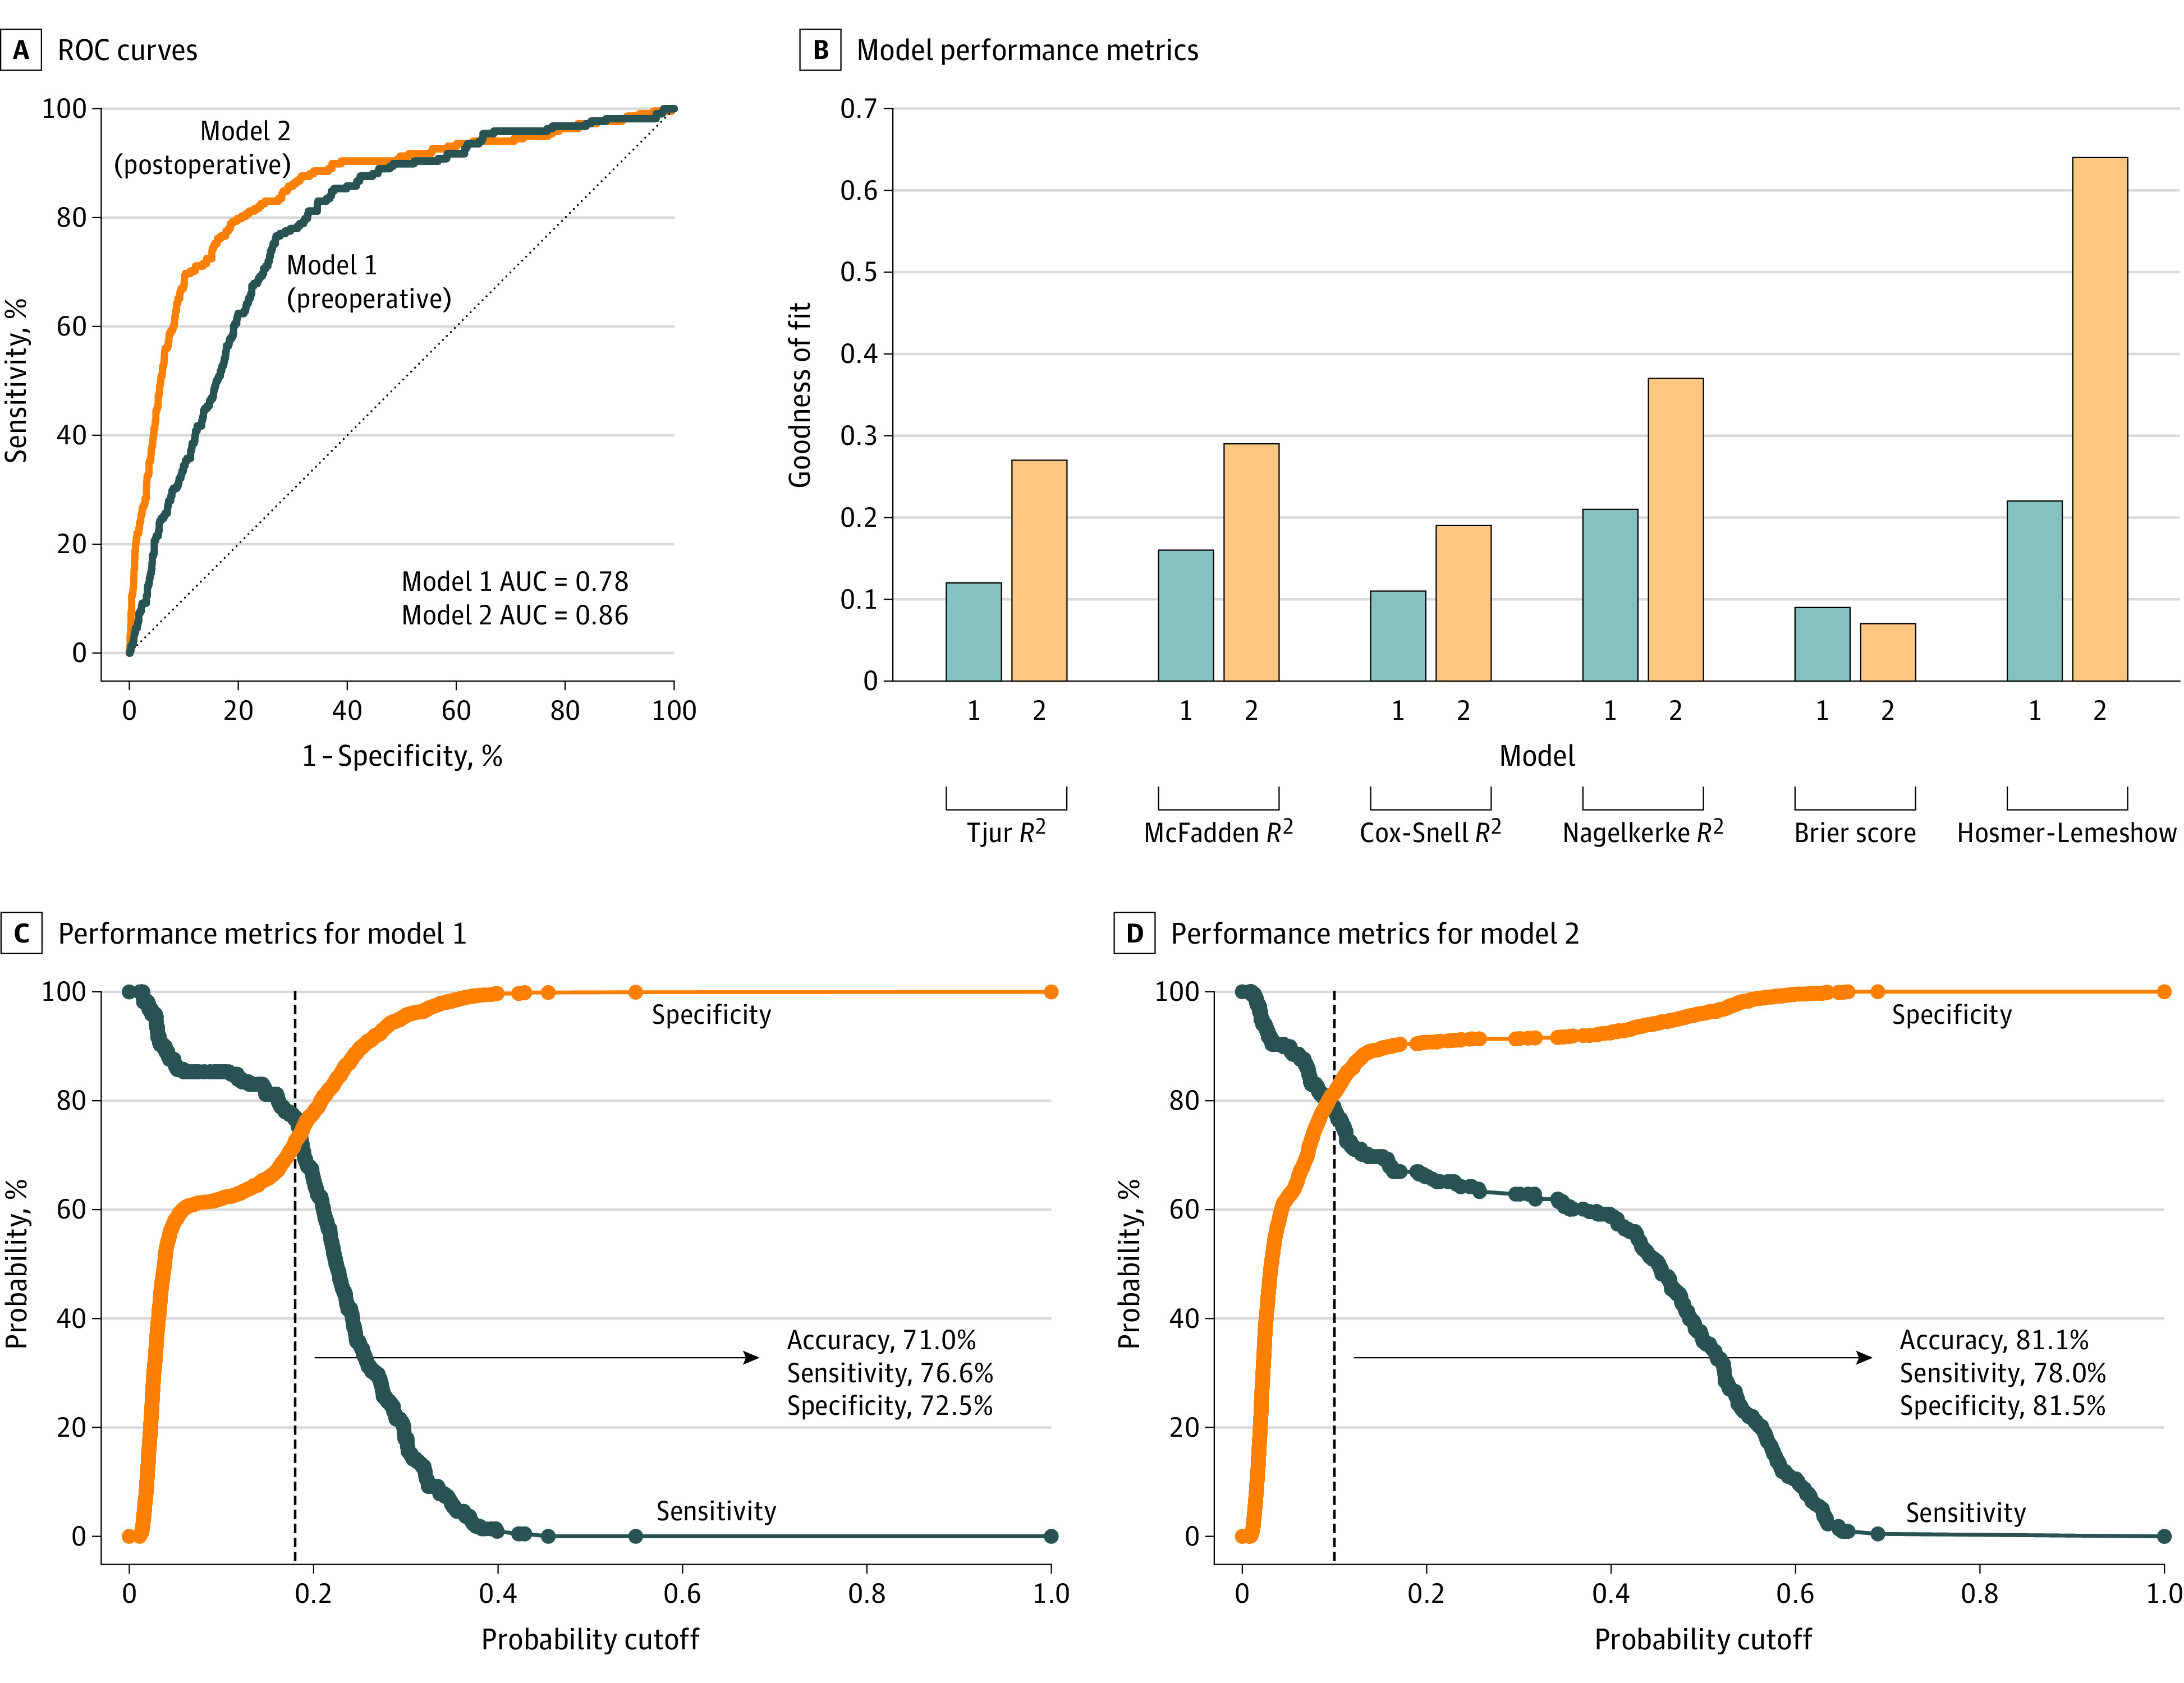
Figure 1. Receiver Operating Characteristic (ROC) Curves and Performance Metrics for the Preoperative (Model 1) and Postoperative (Model 2) Models.

A, ROC curves for model 1 and model 2. B, Goodness of fit and pseudo R2 values for both models. R2 measures differ based on underlying method of calculation but are interpreted similarly; R2 represents the amount of variance explained by the model, where a higher R2 value indicates a stronger model. Brier score is the mean squared error, where a lower score indicates a better model. The Hosmer-Lemeshow test yields a P value representing whether predicted and observed values of a logistic regression are concordant; small values (typically less than 0.05, depending on the significance level) are unfavorable. C, Performance metrics as a function of probability cutoff for model 1. D, Performance metrics as a function of probability cutoff for model 2. Dashed black lines mark the optimal cutoff based on the Youden index (J; model 1, 0.18; model 2, 0.10). The Youden index is a method of assessing the performance of a diagnostic/prognostic test, where J = sensitivity + (specificity − 1). AUC indicates area under the ROC curve.
