
Figure 3. Significant number of genes showing concordant regulation by both insulin and cAMP.
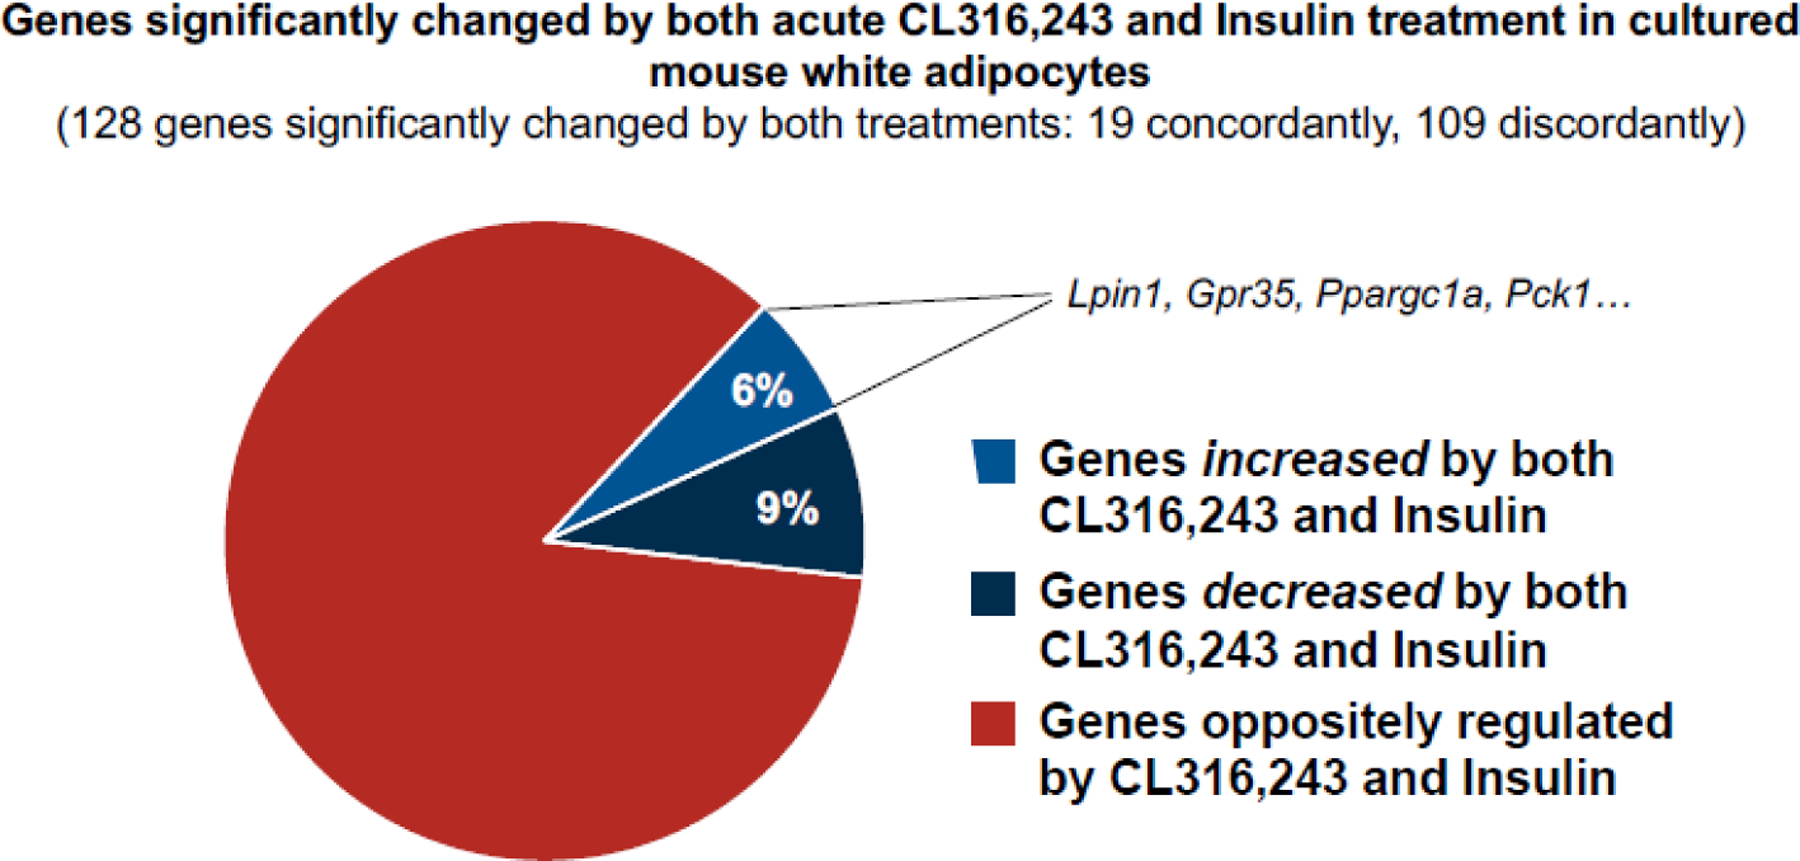
Most genes that are regulated by insulin versus cAMP display opposite expression response profiles. To determine if there are commonly regulated genes, we mined published RNA sequencing datasets from acute insulin stimulation or acute β3-adrenergic stimulation of differentiated white adipocytes cultured in vitro. Preadipocytes from subcutaneous white adipose tissue were induced to differentiate, then treated with 1.72 μM insulin for 8 hours [71] or 10 μM CL316,243, a β3-adrenergic agonist, for 3 hours [72]. Significantly changed gene expressions were defined by the authors. Overall, 128 genes were significantly changed by these treatments, and as expected, most genes (85%) were regulated discordantly by the two treatments. However, 15% (6% upregulated and 9% downregulated) were regulated similarly by insulin and CL316,243. Of note, the expression of 4 of these commonly upregulated genes (Lpin1, Gpr35, Ppargc1a, Pck1) in adipose tissue has been shown to promote glucose homeostasis, insulin sensitivity, and/or metabolic health. This figure was created using BioRender (https://biorender.com/).