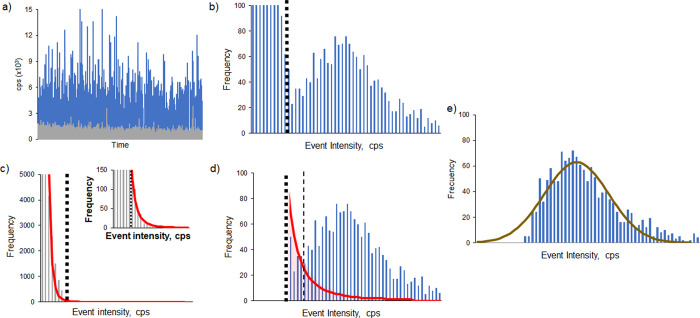
Figure 2.
Data treatment of the sp-ICP-MS signals obtained for the AuNPs of 18.7 nm. The events obtained for the AuNP and the corresponding blank (a, blue and gray, respectively) are sorted to obtain histograms according to their frequency (b and c, respectively). The histogram of the blank was fitted to an exponential curve (red trace, c and d) that was then applied to the NP sample histogram to subtract the blank contribution and to obtain the definitive Gaussian curve (e). Dotted and dashed lines (b–d) correspond to the threshold values of 3σ and 5σ of the blank.

