
Fig. 4.
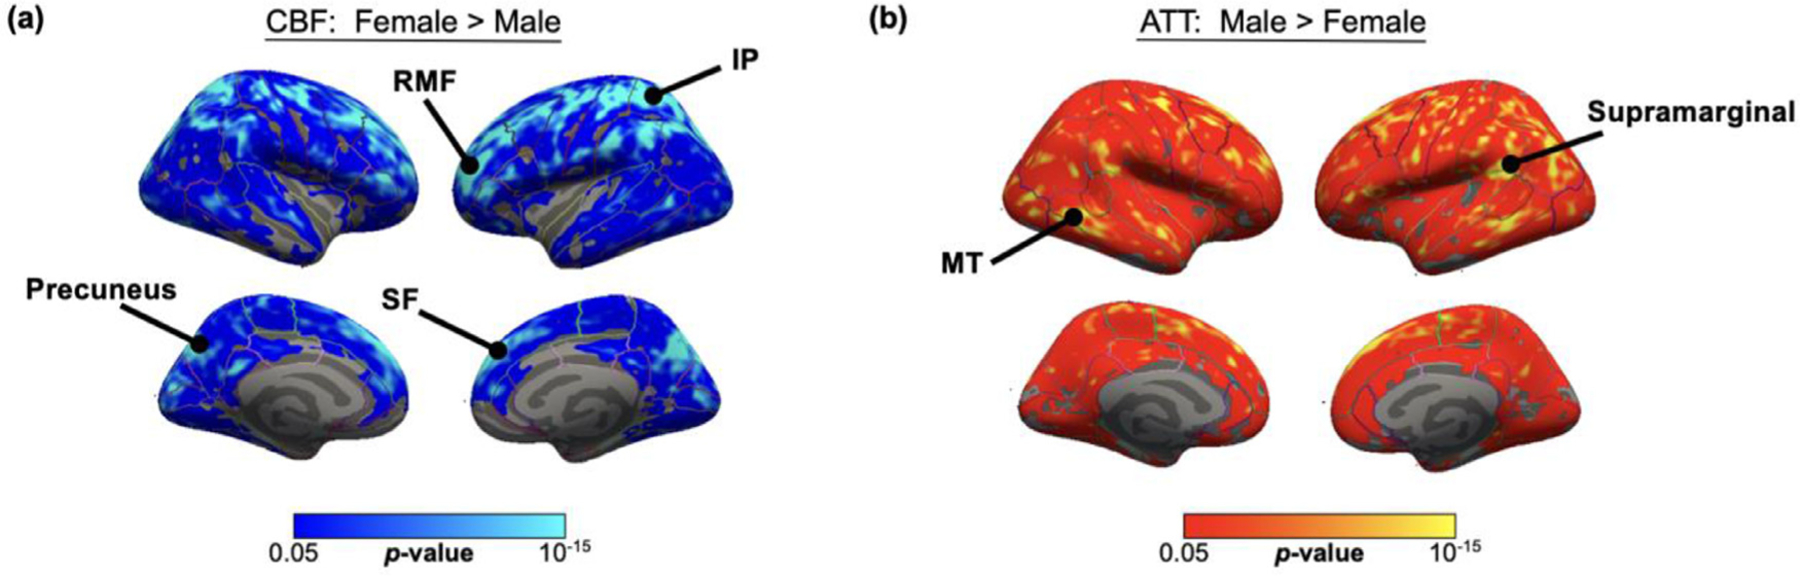
Spatial maps of surface analysis for significant impact of sex on (a) CBF and (b) ATT in large cohort, using Freesurfer general linear model including both sex and age as regressors, cluster-wise corrected for multiple comparisons. Only significant statistics that survive cluster-wise correction at p < 0.05 are displayed. Females demonstrated higher CBF across the parietal and frontal cortices, whereas males demonstrated higher ATT across the superior frontal cortex and temporal lobe. SF = Superior Frontal, RMF = Rostral Middle Frontal, MT = Middle Temporal, IP = Inferior Parietal, ST = Superior Temporal.