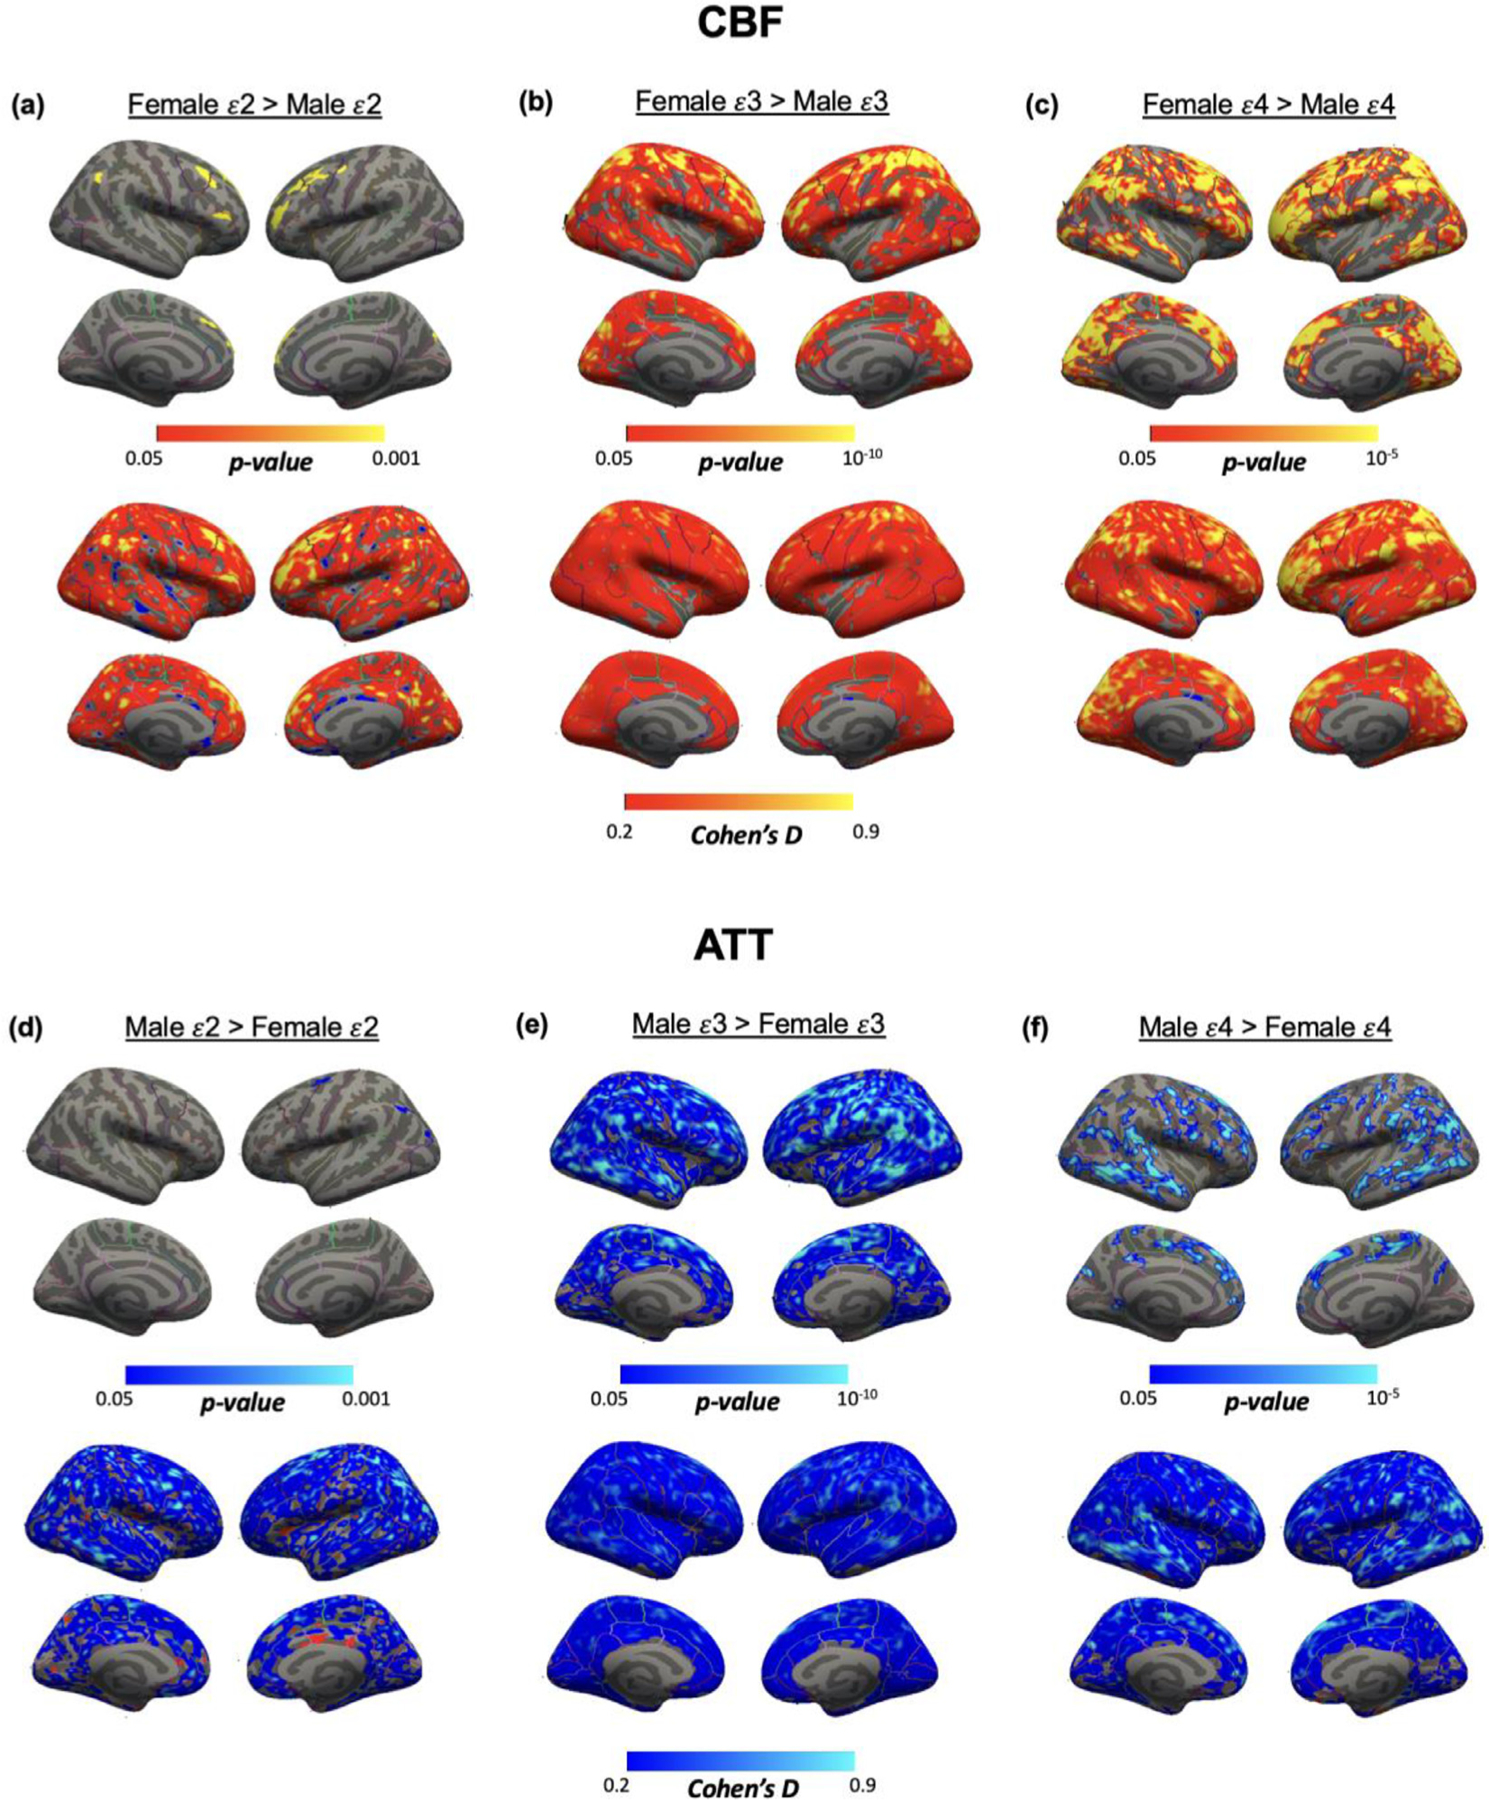
Fig. 6.

Spatial maps of surface analysis for sex differences within APOE genotype of (a, b, c) CBF and (d, e, f) ATT, using Freesurfer general linear model including both age and sex as regressors but only modeling the data from APOE genotype of interest, cluster-wise corrected for multiple comparisons. Only significant statistics that survive cluster-wise correction at p < 0.05 are displayed. Bottom rows show effect size maps (Cohen’s D). Different spatial distributions of sex differences were identified based on APOE genotype.
