
Figure 2.
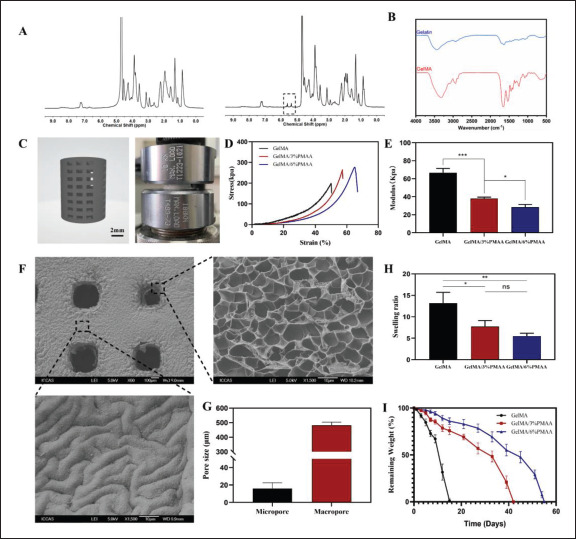
Characterization and degradation of GelMA/PMAA scaffolds. (A) 1H NMR spectra of gelatin (left) and GelMA (right). (B) FTIR spectra of gelatin and GelMA. (C) Images of 3D modeling and compression test of scaffolds. (D) The compressive stress–strain curves of scaffolds. (E) Compressive modulus of scaffolds. (F) SEM image of a 3D-printed scaffold. (G) Pore size of scaffolds. (H) Swelling of different scaffolds. (I) In vitro degradation behavior of the three scaffolds in PBS (37°C, pH = 7.4). Data were analyzed via a one-way ANOVA analysis and are shown as mean ± standard deviation (*p < 0.05, **p < 0.01, ***p < 0.001, n = 3).