
Figure 6.
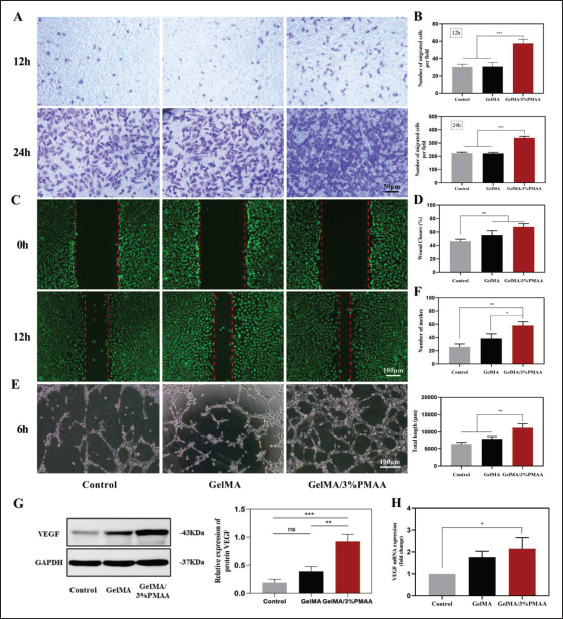
Capacity for migration and vascular regeneration of HUVECs. (A, B) Transwell assay at 12 h and 24 h. (C, D) Migration experiment of scratch wound assay at 12 h and quantitative results of wound closure. (E, F) The endothelial tube formation in HUVECs at 6 h after culturing with different scaffolds and summarized data of total length and number of meshes. (G) Protein expression VEGF in HUVECs using Western blot. (H) Gene expression of VEGF in HUVECs using quantitative real-time PCR. Data were analyzed via one-way ANOVA and are shown as mean ± standard deviation (*p < 0.05, **p < 0.01, ***p < 0.001, n = 3).