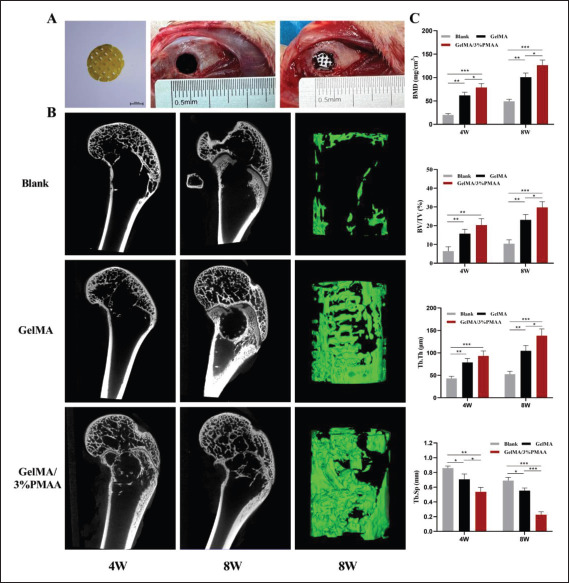
Figure 7.

Micro-CT analysis of new bone formation at week 4 (4W) and week 8 (8W). (A) Images of the scaffold and its implantation into the defect site of femoral condyle. (B) Micro-CT images at week 4 and week 8 with the reconstructed images of femur defects at week 8. (C) The micro-architectural parameters of newly formed bone. (BMD, bone mineral density; BV/TV, bone tissue volume/total tissue volume; Tb.Th, trabecular thickness; Tb.Sp, trabecular separation). Data were analyzed via one-way ANOVA and are shown as mean ± standard deviation (*p < 0.05, **p < 0.01, ***p < 0.001, n = 3).
