
Figure 5.
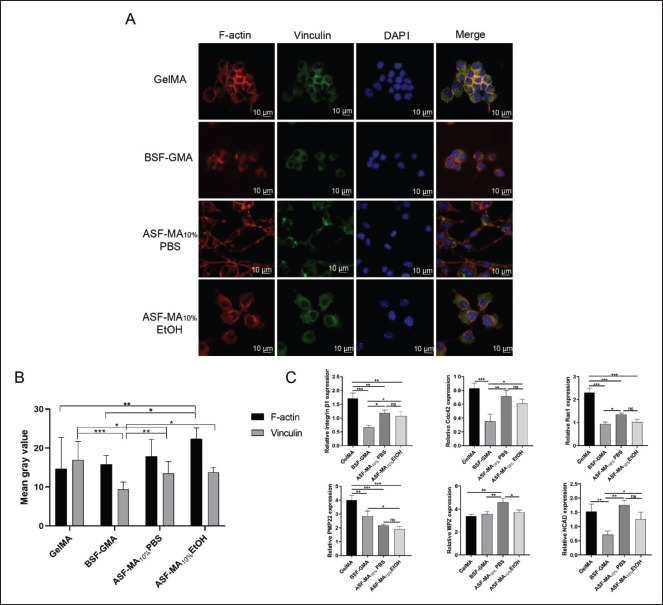
(A) Immunofluorescence staining images of S16 cells after being cultured on various hydrogel surfaces. The red, green, and blue fluorescence represent the cytoskeletal F-actin fibers, vinculin, and cell nuclei, respectively. (B) Semi-quantitative analysis of vinculin and F-actin fluorescence of S16 cells on the hydrogels. (C) Relative expression levels of various genes in S16 cells on various hydrogel surfaces. (ns: p > 0.05, *p < 0.05, **p < 0.01, ***p < 0.001)