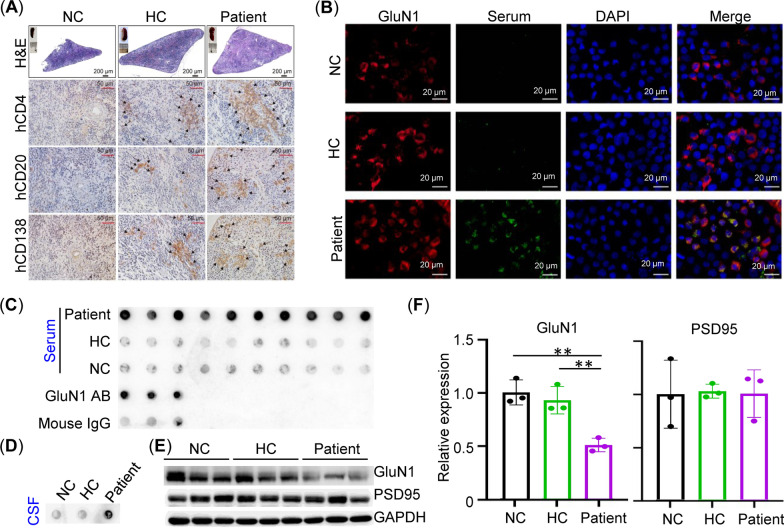
Fig. 2.
Production of autoantibody against GluN1 and hippocampal GluN1 loss in patient PBMC-humanized mice. A Representative micrographs of H&E stainings and immunohistochemical stainings of hCD4, hCD20, and hCD138 in splenic sections of BRGSF mice injected with medium (NC) or PBMCs (HC or patient) (n = 3/group). B Immunofluorescence of M68CT–GluN1 in HEK-293T cells (n = 3/group). Red, signals detected by commercial anti-GluN1 antibody. Green, signals detected by mouse serum from different groups. Nuclei were counterstained with DAPI (blue). C Dot blot using serum from mice (n = 10/group) to detect the extracellular region of GluN1 (N21–Q559). Commercial GluN1 antibody (AB) and mouse IgG were used as positive control and negative controls (n = 3), respectively. D Dot blot using pooled CSF from mice (pooled from 10 mice/group) to detect the extracellular region of GluN1 (N21–Q559). E Western blot of hippocampal GluN1 and PSD95 from NC group, HC group, and patient-group mice (n = 3/group). F Statistical analysis of relative protein expression in E. **p < 0.01, one-way ANOVA with Tukey’s post hoc test

